 Blending process monitoring with in-line NIR spectroscopy
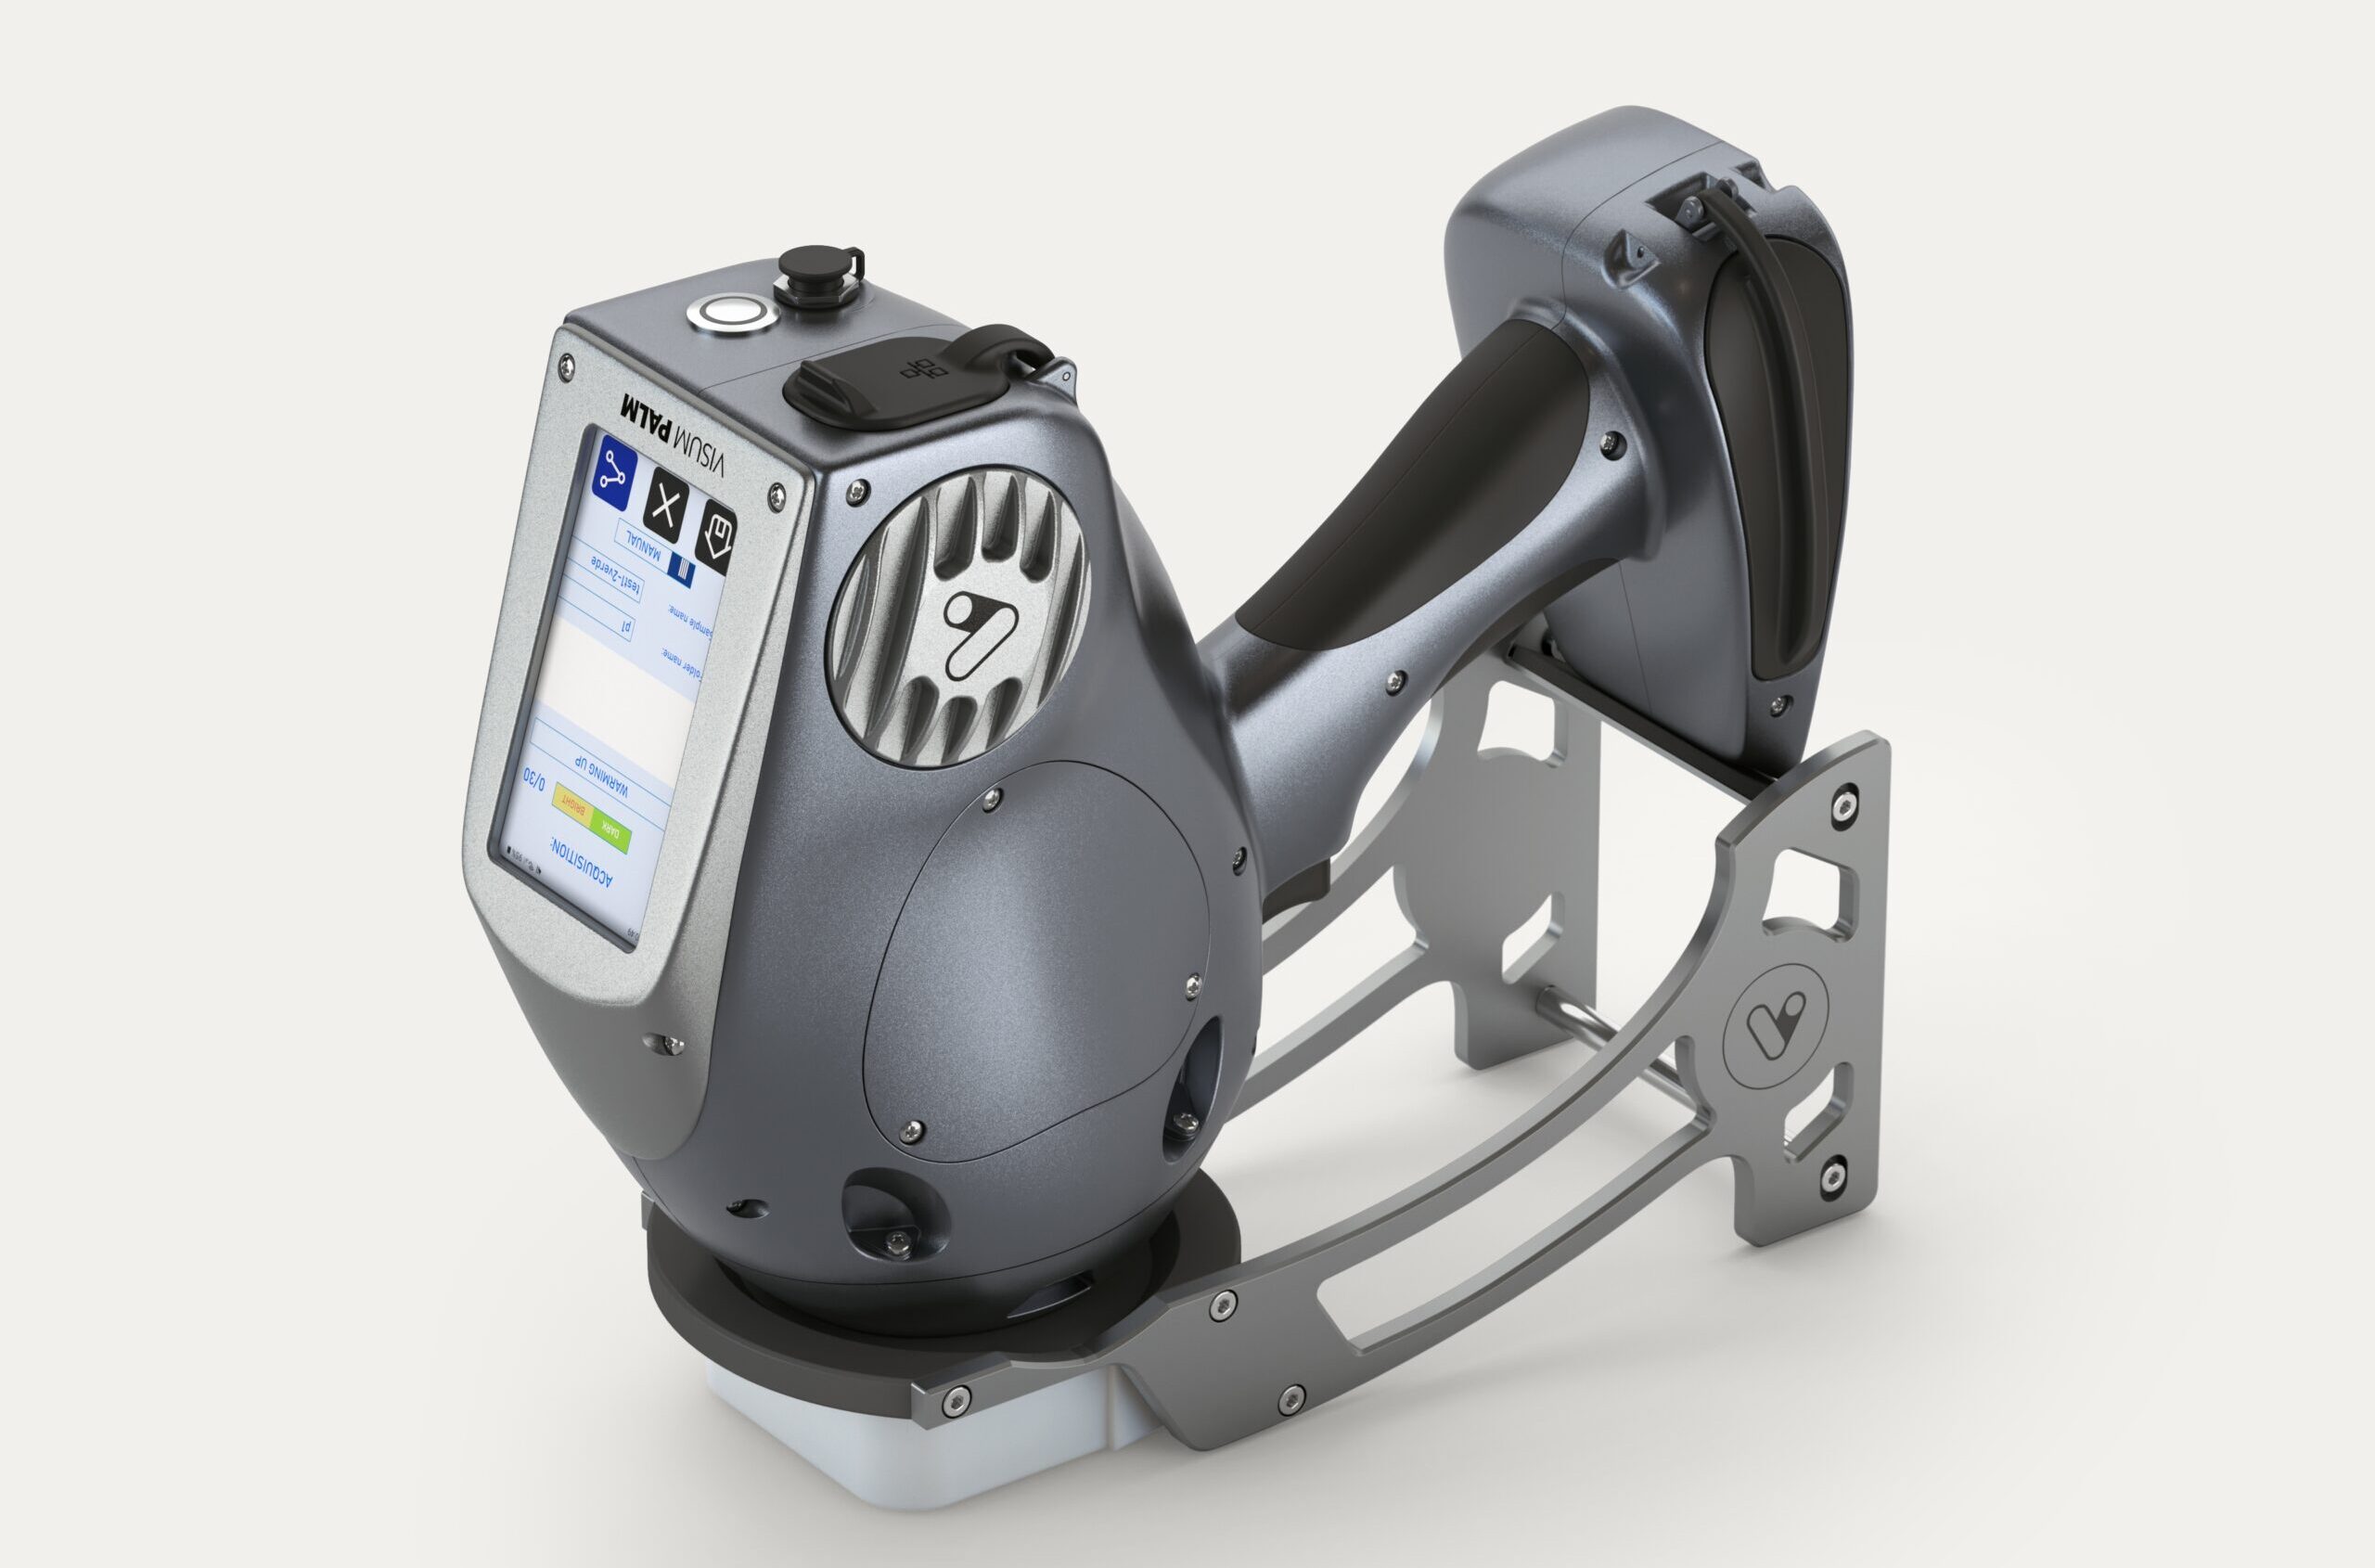 Jaki jest najlepszy przenośny analizator NIR na rynku? Porównanie Visum Palm™ z innymi przenośnymi analizatorami

Analizator procesu Raman do monitorowania rapamycyny w czasie rzeczywistym: wyniki porównywalne z HPLC

Analizator procesu Raman in-line stosowany w oczyszczaniu rapamycyny
Spektroskopia Ramana, gdy jest wdrażana jako analizator procesu Raman do pomiarów w czasie rzeczywistym, stanowi potężną technologię kontroli i optymalizacji procesów w produkcji farmaceutycznej i biotechnologicznej. W tym kontekście analizator procesu Raman in-line opracowany i produkowany przez IRIS Technology Solutions (Barcelona) wyróżnia się jako wysokowydajne rozwiązanie analityczne do ilościowego oznaczania kluczowych związków w czasie rzeczywistym oraz ciągłego monitorowania wydajności procesu.
W przeciwieństwie do konwencjonalnych technik analitycznych, takich jak HPLC, które wiążą się z opóźnionymi czasami reakcji, materiałami eksploatacyjnymi i intensywnym wykorzystaniem zasobów laboratoryjnych, analizator procesu Raman zapewnia bezpośredni wgląd w proces w czasie rzeczywistym. Niniejszy artykuł przedstawia konkretne zastosowanie przemysłowe: wykorzystanie analizatora Visum Raman In-Line do monitorowania stężenia rapamycyny podczas etapu oczyszczania.
Wyniki pokazują, że ten analizator procesu Raman, zintegrowany w konfiguracji at-line i zamontowany na mobilnym stojaku, może skutecznie zastąpić analizę HPLC offline. Aplikacja została opracowana we współpracy z firmą farmaceutyczną MyBiotech GmbH (Niemcy) i ilustruje wartość analityki procesowej opartej na spektroskopii Ramana w ramach strategii PAT.
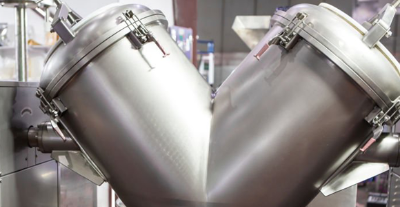
Proces ekstrakcji i oczyszczania rapamycyny
Rapamycyna jest związkiem makrolidowym szeroko stosowanym w zapobieganiu odrzucaniu przeszczepów narządów. Jest wytwarzana w procesie fermentacji poprzez hodowlę Streptomyces rapamycinicus w bioreaktorach w kontrolowanych warunkach podawania substratu, temperatury i pH. Po fermentacji rapamycyna jest ekstrahowana przy użyciu rozpuszczalnika organicznego, co prowadzi do powstania złożonej mieszaniny zawierającej związek docelowy oraz liczne produkty uboczne.
Ekstrakt jest następnie oczyszczany w kolumnie chromatograficznej, gdzie rapamycyna jest oddzielana od zanieczyszczeń i zbierana w wzbogaconych frakcjach. Tradycyjnie próbki są ręcznie pobierane z wylotu kolumny i analizowane metodą HPLC w celu określenia, które frakcje zawierają rapamycynę i w jakim stężeniu.
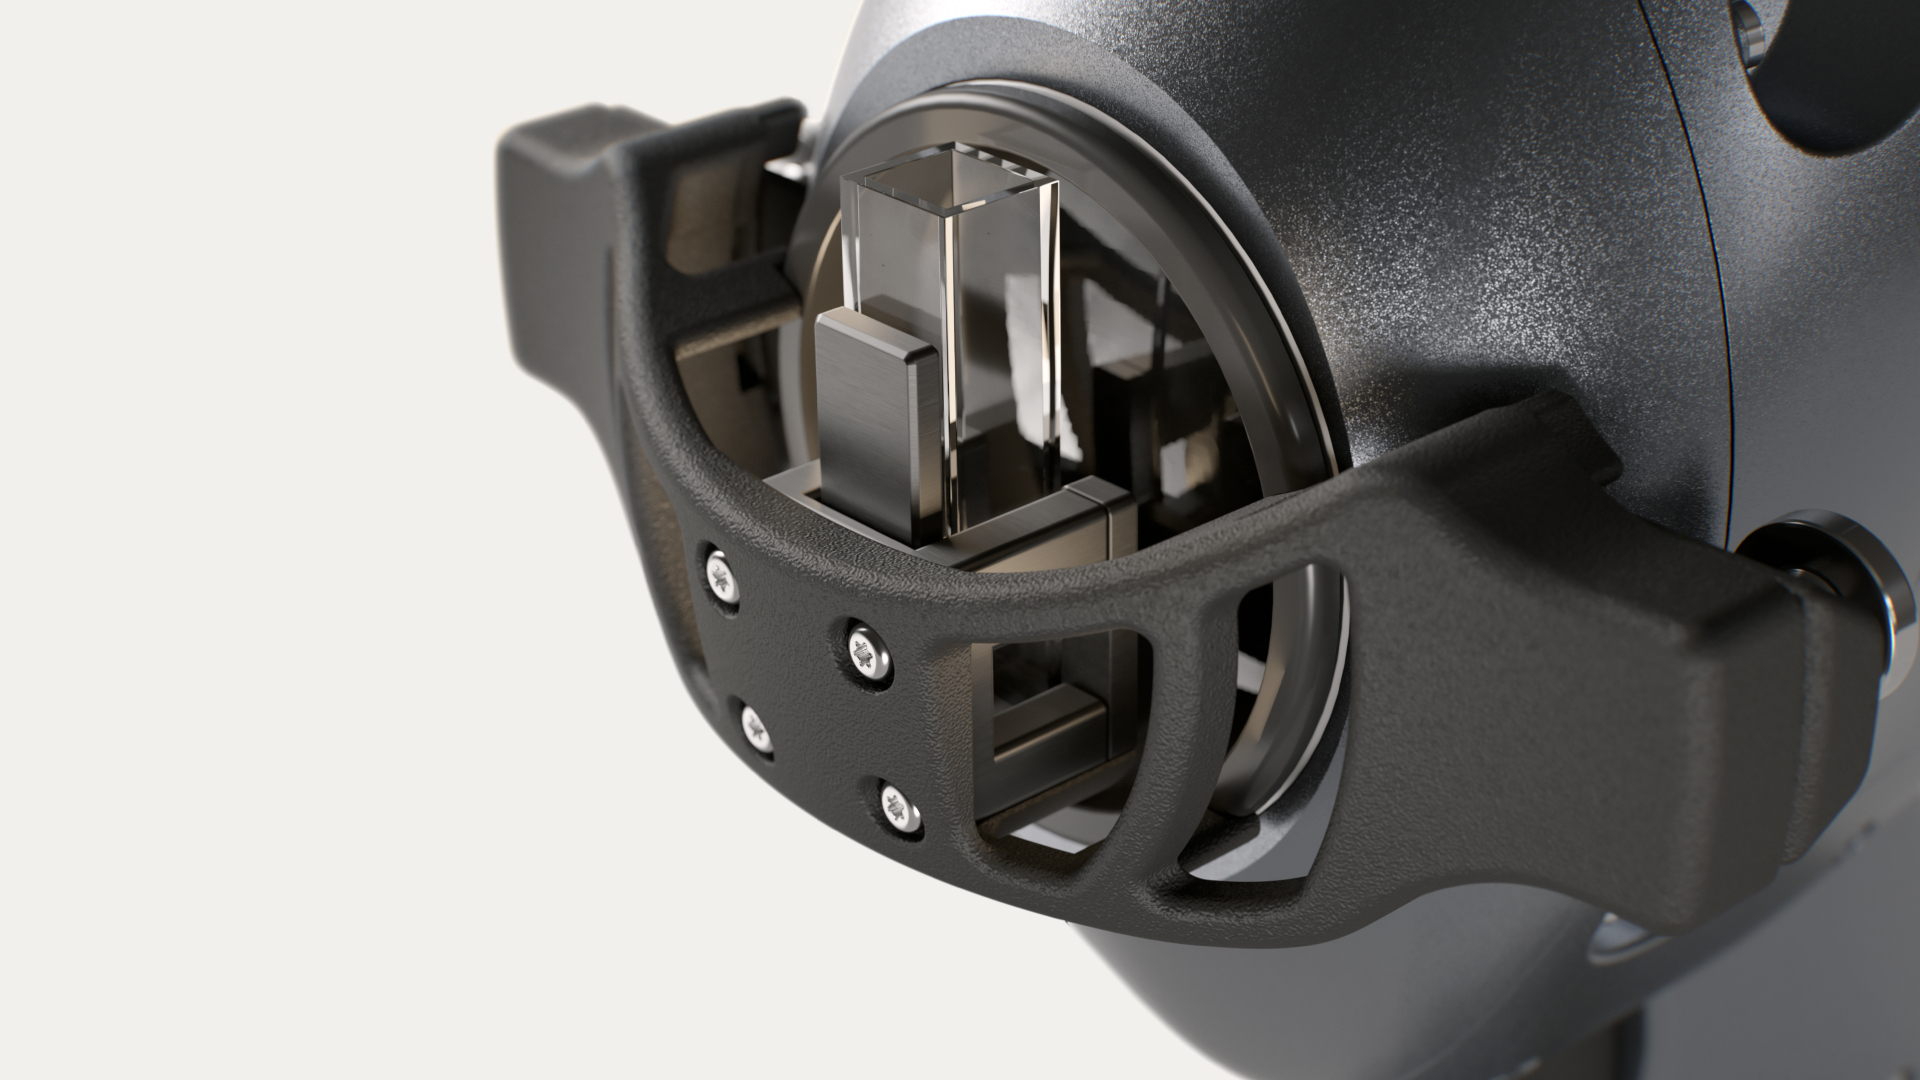
Aby zastąpić ten tryb pracy offline, na wylocie kolumny chromatograficznej zainstalowano dedykowaną komorę pomiarową. Sonda zanurzeniowa podłączona do analizatora procesu Raman została umieszczona w tej komorze, umożliwiając ciągły pomiar stężenia rapamycyny w czasie rzeczywistym. Takie rozwiązanie pozwoliło na natychmiastowe podejmowanie decyzji dotyczących zbierania frakcji, ich klasyfikacji, recyrkulacji rozpuszczalnika lub odrzutu, eliminując błędy, opóźnienia i ryzyko zanieczyszczeń związane z ręcznym pobieraniem próbek.
Integracja analizatora procesu Raman in-line
Visum Raman In-Line został wdrożony jako analizator procesu Raman in-line, skonfigurowany w układzie at-line na mobilnym stojaku. Taka elastyczna integracja umożliwiła pracę analizatora bezpośrednio obok systemu oczyszczania, przy jednoczesnym zachowaniu pełnego dostępu i widoczności dla operatorów.
Sonda Raman w sposób ciągły mierzyła strumień procesu na wylocie kolumny, dostarczając informacji w czasie rzeczywistym o obecności i stężeniu rapamycyny. Podczas typowego przebiegu separacji, który może trwać kilka godzin, dla każdej frakcji zbierano wiele pomiarów Raman, zapewniając znacznie wyższą rozdzielczość czasową niż w przypadku analiz opartych na HPLC.
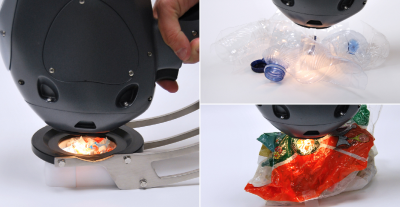
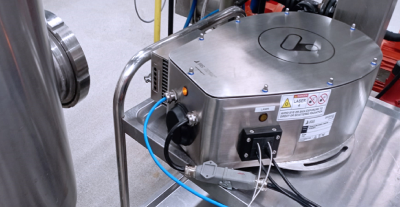
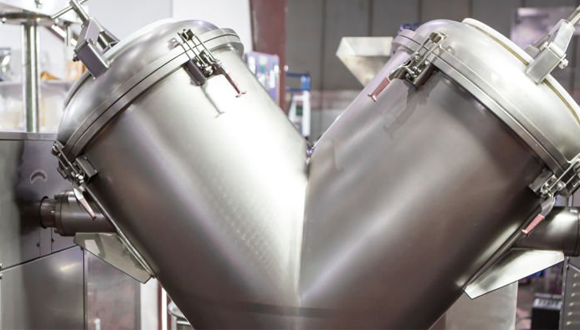
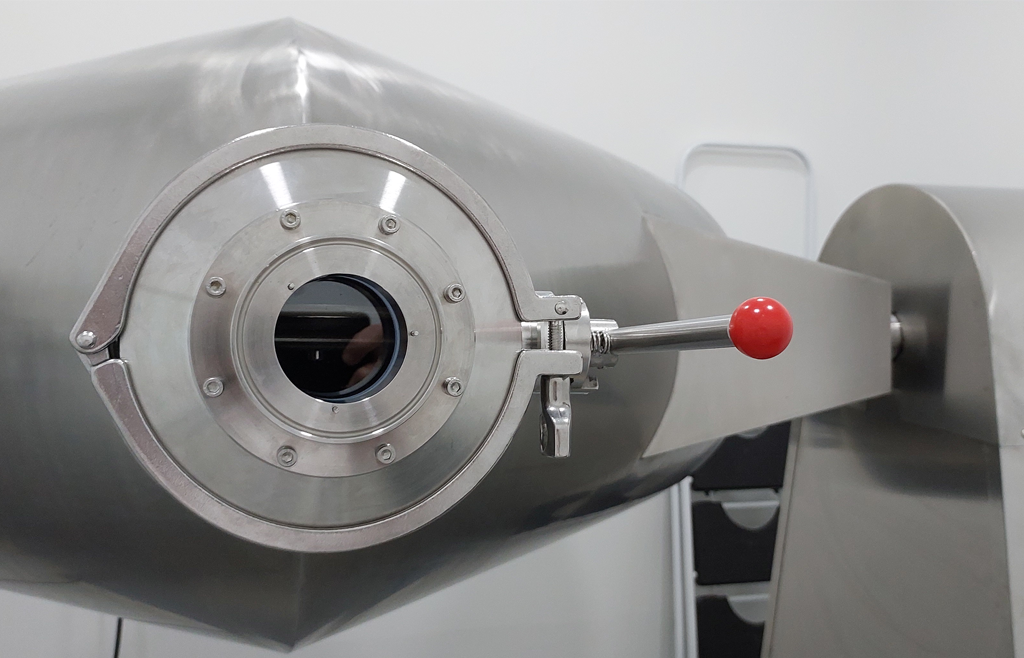
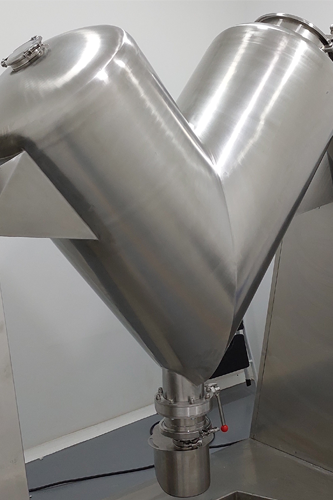
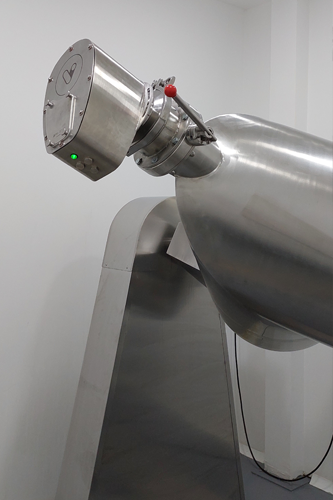
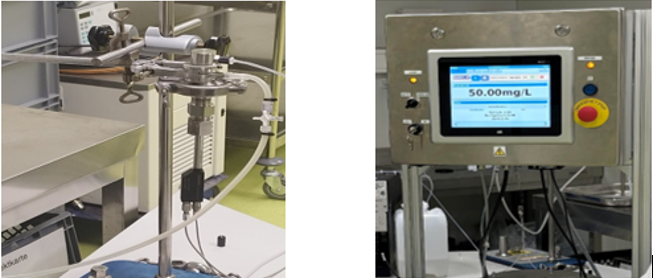
Rysunek 1.
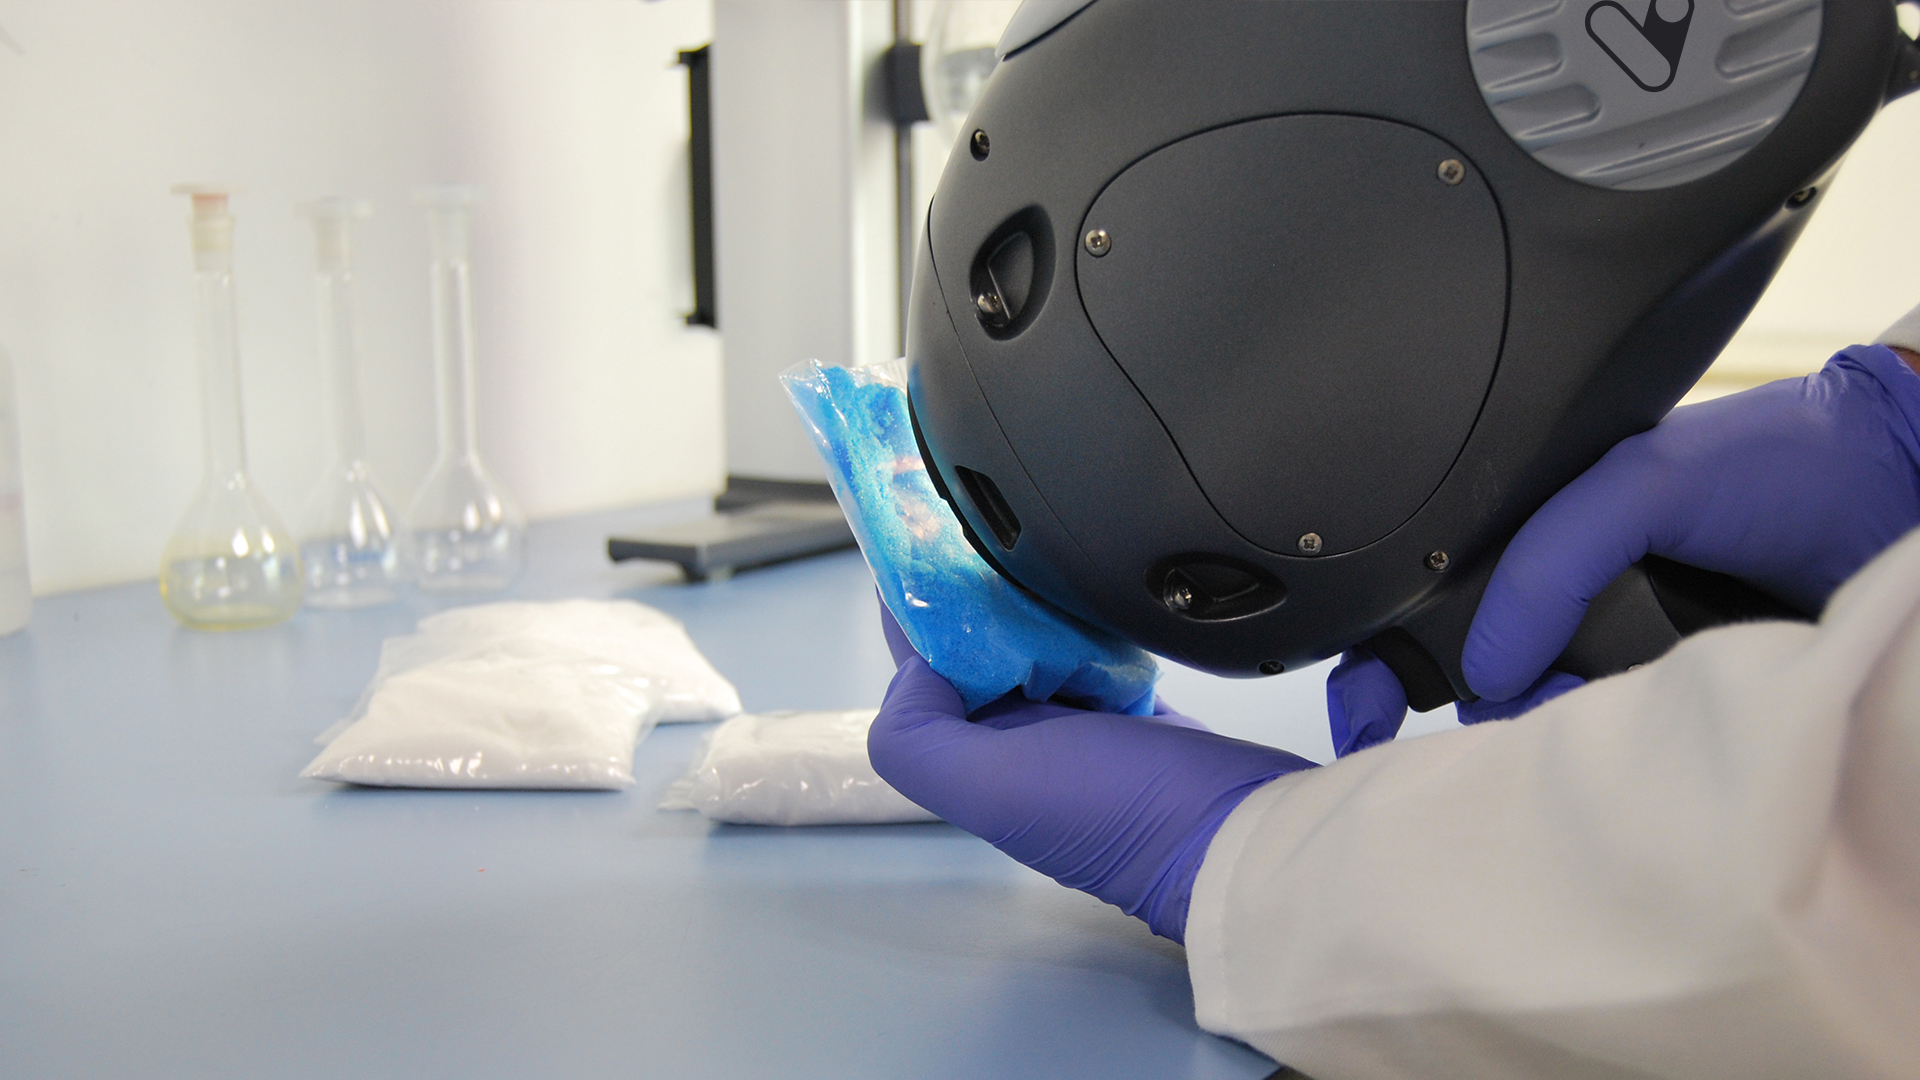
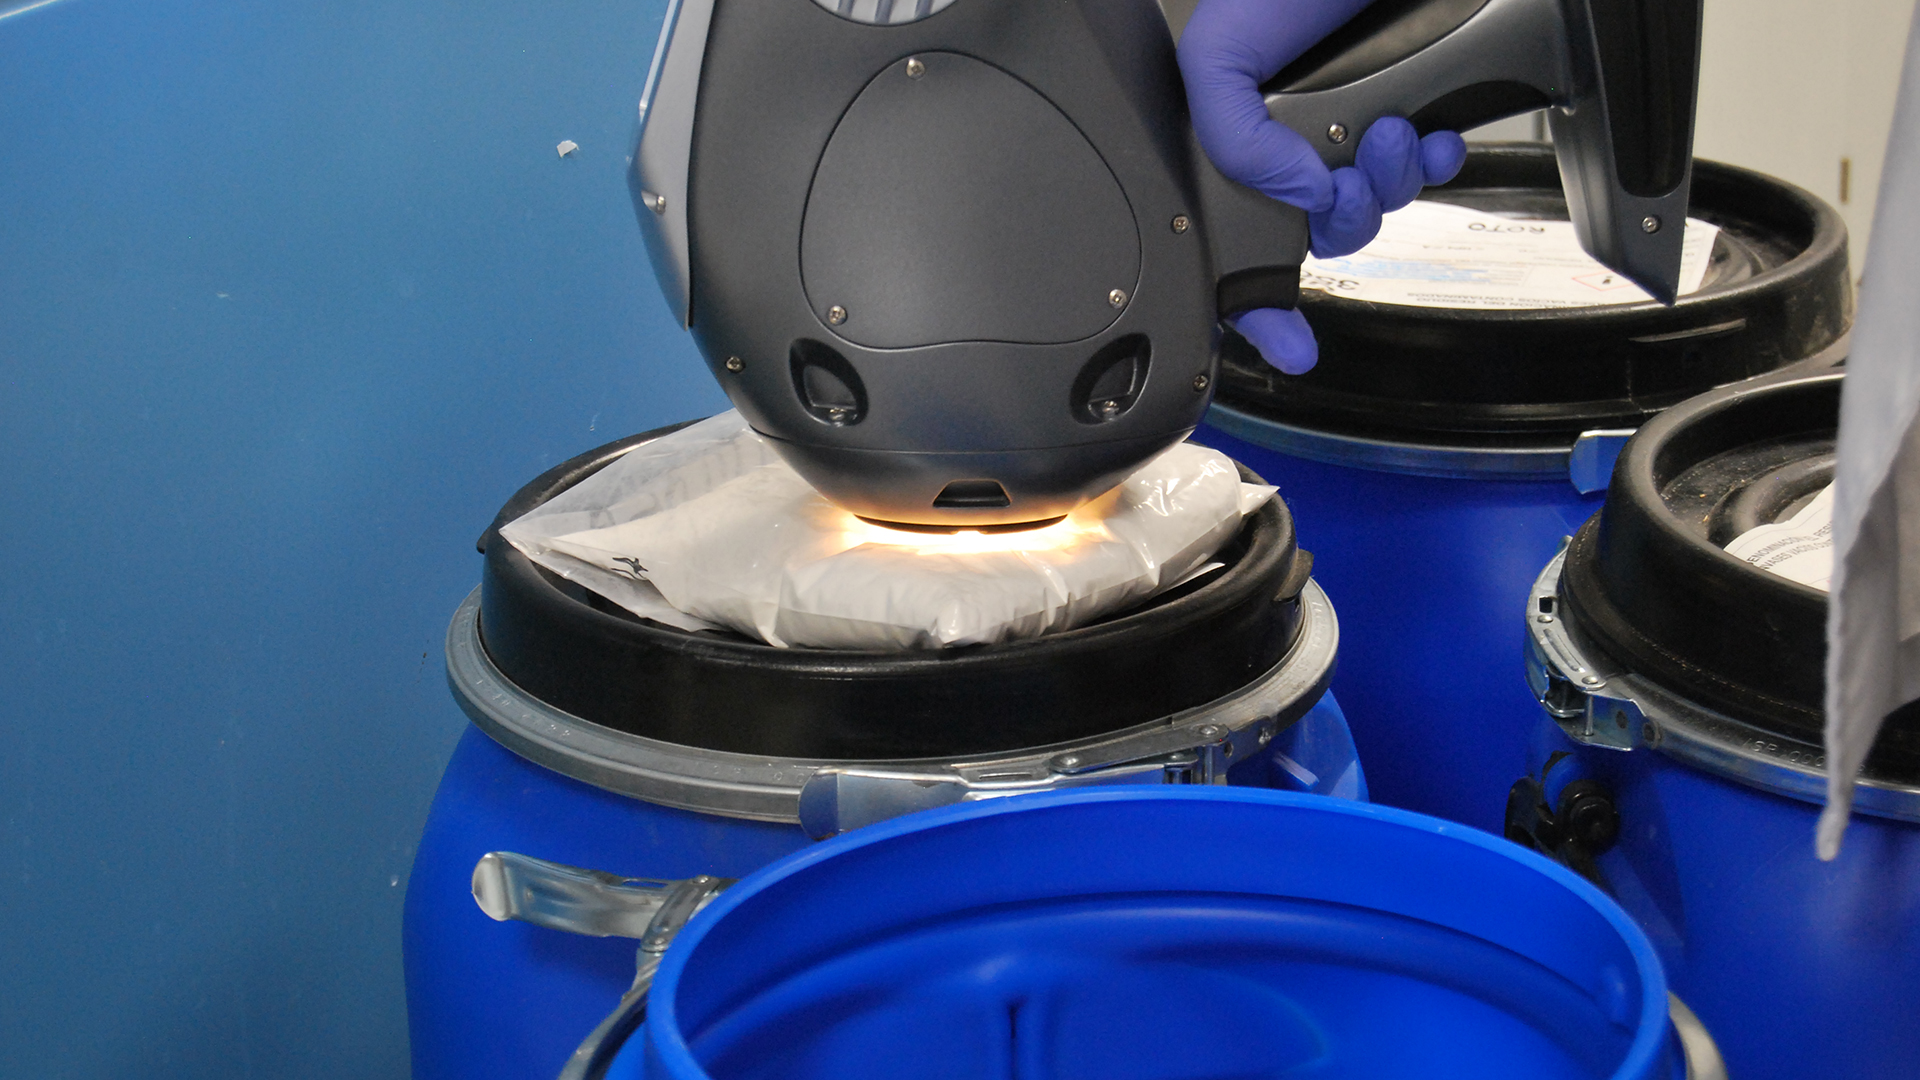
U góry: system oczyszczania rapamycyny.
Na dole po lewej: sonda Raman umieszczona w komorze pomiarowej.
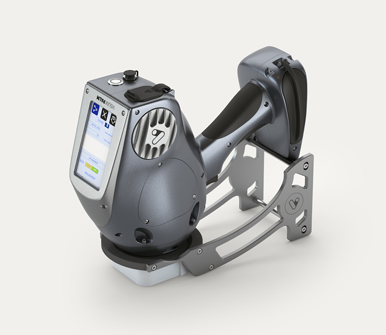
Na dole po prawej: ekran analizatora procesu Raman zamontowanego na mobilnym stojaku, prezentujący stężenie rapamycyny w czasie rzeczywistym.

Kalibracja i modelowanie chemometryczne analizatora procesu Raman
Do kalibracji analizatora procesu Raman oceniono sześć różnych preparatów. Preparaty te obejmowały zakres stężeń rapamycyny, profile produktów ubocznych oraz natężenia przepływu, zapewniając realistyczną zmienność procesu.
Analizator skonfigurowano do rejestrowania trzech widm Raman na minutę i raportowania wartości uśrednionych. Na potrzeby opracowania modelu chemometrycznego wszystkie widma Raman zarejestrowane podczas napełniania każdej kolby zostały uśrednione w celu uzyskania jednego widma reprezentatywnego dla każdej wartości referencyjnej HPLC.
Zastosowano zaawansowane techniki chemometryczne do przetwarzania danych widmowych i budowy modeli ilościowych. Aby zapewnić realistyczną ocenę wydajności, każdy preparat traktowano jako niezależny zestaw walidacji zewnętrznej. W praktyce model wykorzystywany do predykcji jednego preparatu był opracowywany na podstawie danych z pozostałych pięciu preparatów. Procedurę tę powtarzano aż do niezależnego przewidzenia wszystkich sześciu preparatów przez analizator.
Wyniki uzyskane z analizatora procesu Raman
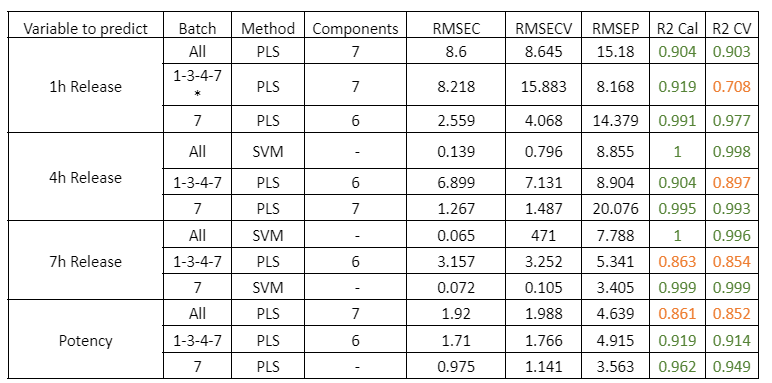
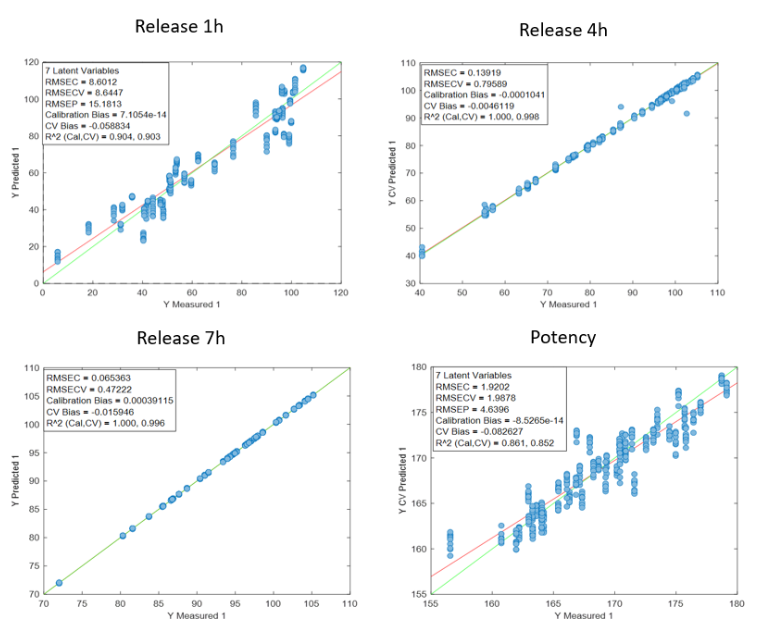
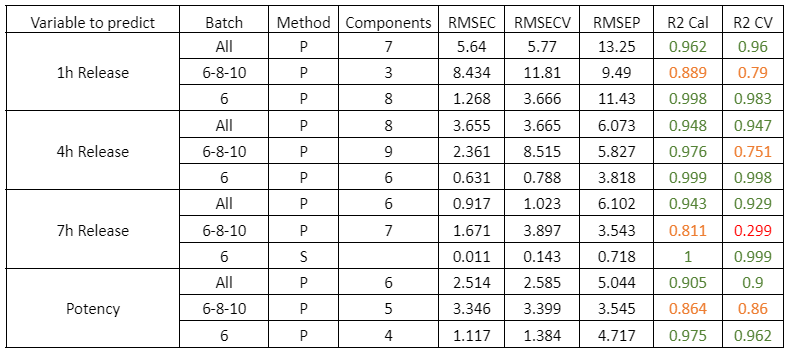
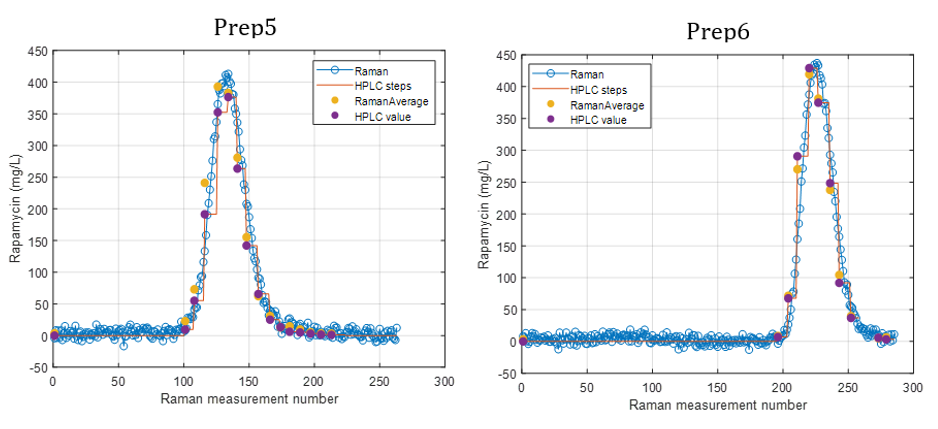
Rysunek 2 przedstawia wyniki predykcji uzyskane za pomocą analizatora procesu Raman in-line dla sześciu preparatów. Trend stężenia rapamycyny przewidywany metodą spektroskopii Ramana ściśle odpowiada trendowi zmierzonemu metodą HPLC.
Dla każdego punktu danych HPLC dostępnych było od trzech do ośmiu predykcji Raman. Średnia tych predykcji wykazała wysoką zgodność z odpowiadającymi wartościami HPLC. Jedno odchylenie zaobserwowano dla Preparatu 3, gdzie prawdopodobnie doszło do rozbieżności pomiędzy pomiarem Raman a pobraną próbką HPLC z powodu różnic czasowych pomiędzy pomiarem a zbieraniem frakcji.
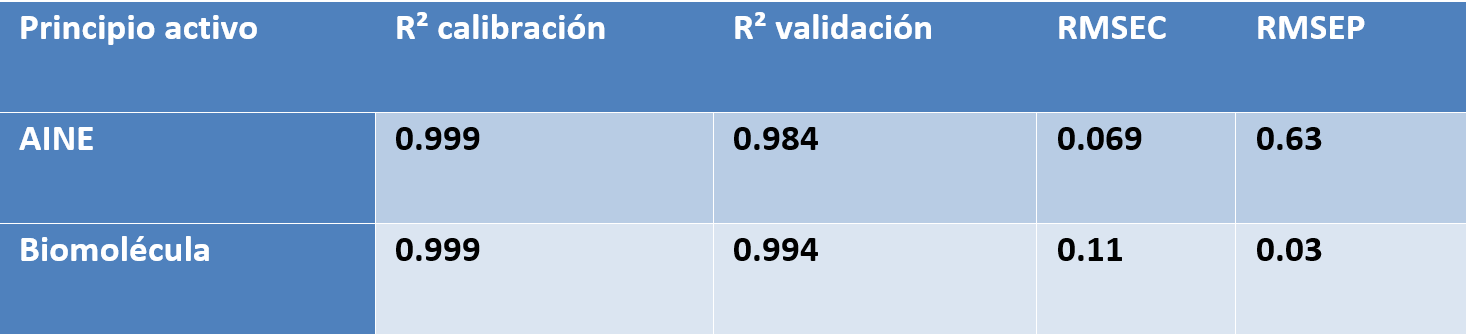
Po porównaniu wszystkich wartości przewidywanych i referencyjnych analizator osiągnął niski błąd predykcji wynoszący 15,7 mg/L oraz wysoki współczynnik determinacji (R² = 0,98). Błąd ten jest porównywalny z granicą oznaczalności metody.
Przy stężeniach rapamycyny poniżej 15 mg/L predykcje Raman wahały się w zakresie od −15 do +15 mg/L, co wskazuje na praktyczną granicę wykrywalności modelu. W zwalidowanym zakresie stężeń 15–450 mg/L analizator procesu Raman in-line wykazał doskonałą dokładność, z wynikami bardzo zbliżonymi do uzyskiwanych metodą HPLC.
Rysunek 2.
Stężenie rapamycyny przewidywane przez analizator procesu Raman oraz dane referencyjne HPLC w czasie dla sześciu preparatów.

Znaczenie dla analityki procesowej Raman i zastosowań PAT
Badanie to potwierdza, że analizator procesu Raman jest niezawodnym i precyzyjnym rozwiązaniem do monitorowania oczyszczania rapamycyny w czasie rzeczywistym. Visum Raman In-Line umożliwił ciągłą ilościową analizę rapamycyny przy wydajności porównywalnej z HPLC, jednocześnie znacząco zwiększając efektywność i szybkość reakcji procesu.
Eliminując konieczność ręcznego pobierania próbek i analiz offline, analizator procesu Raman in-line Visum zmniejszył obciążenie laboratoriów, przyspieszył podejmowanie decyzji i poprawił kontrolę procesu. Zalety te czynią analitykę procesową opartą na spektroskopii Ramana szczególnie atrakcyjną dla przemysłu farmaceutycznego i biotechnologicznego.
Podejście to jest w pełni przenaszalne na inne zastosowania, w których kluczowe znaczenie ma ilościowa analiza w czasie rzeczywistym podczas oczyszczania lub formulacji, takie jak przeciwciała, białka rekombinowane, szczepionki, metabolity oraz inne substancje czynne. Jako element szerszej strategii PAT, analizator procesu Raman zapewnia ciągły wgląd w proces, umożliwiając wyższą efektywność, lepszą kontrolę jakości oraz bardziej stabilne operacje produkcyjne.