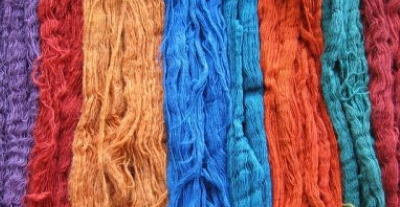
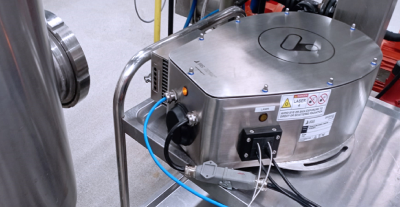
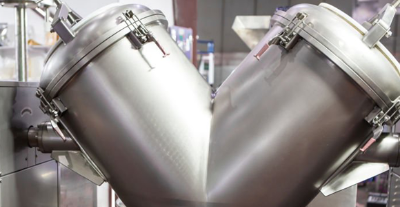
 Blending process monitoring with in-line NIR spectroscopy
 RESCHAPE PROJECT: RESHAPING SUPPLY CHAINS FOR POSITIVE SOCIAL IMPACT

Control of the coating process of granular forms by NIR spectroscopy
Control of the coating process of granular forms by NIR spectroscopy
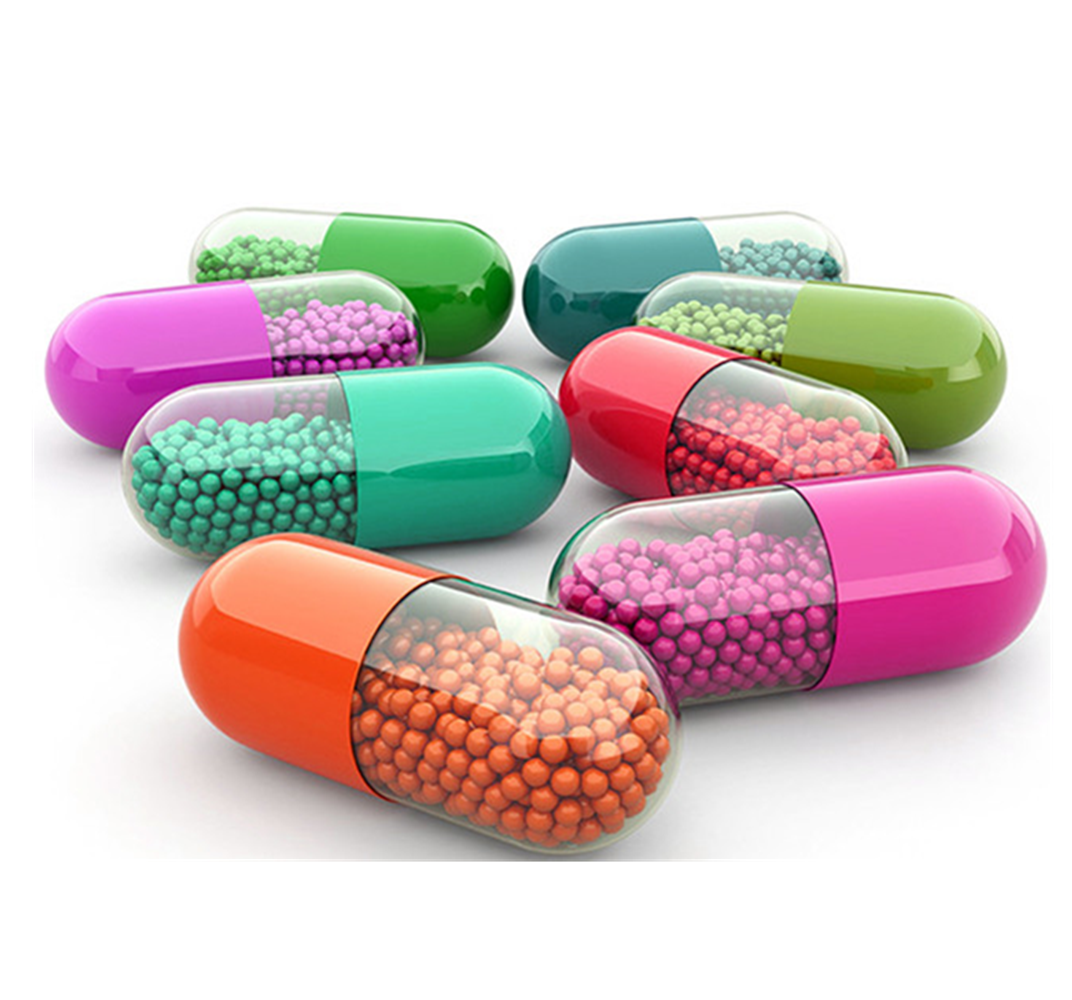
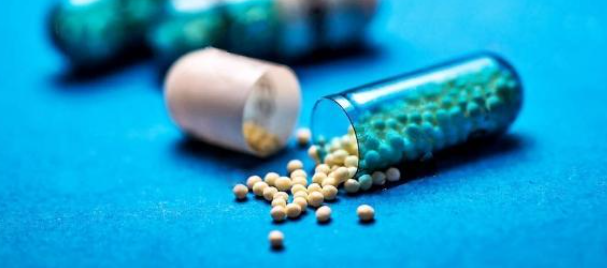
In the pharmaceutical industry, there are many granular formulations that are coated to achieve a sustained or controlled release of the drug or active pharmaceutical ingredient (API) over time, a clear and well-known example being Omeprazole. In this paper we will discuss these extended release formulations and how it is possible to optimize the release time and potency analyses during the coating process using NIR spectroscopy.
Pelletisation process and traditional analysis
During the pelletisation process of modified release dosage forms, the correct application of the coating (e.g. an enteric release coating intended to prevent gastric digestion or degradation) will determine the subsequent efficacy of the drug and the mg/API release time of the drug and therefore controls are carried out throughout this process to ensure the quality and thus the expected pharmacological action.
Currently, this control is performed during the coating process with samples obtained from the coating equipment at different times and analysed in the laboratory using the analytical technique of HPLC or liquid chromatography and dissolution testing to demonstrate that the release of the active ingredient(s) is satisfactory. Both methods require sample preparation prior to analysis, require specialised personnel and consumables (materials), in addition to the duration (hours) of a dissolution test, whose main objective is to determine the bioavailability of the drug, meaning the relative amount of the drug that has entered the general circulation after administration, and the rate at which this access has occurred.
Therefore, the major problem with traditional analytics is that it is time-consuming to obtain the results and therefore does not allow for timely rectification of the coating process in case of failures or, in the frequent case of stopping the process for sampling, there is a risk that the quality of the semi-product will be altered.
An alternative and very effective tool that allows real-time monitoring of the coating process is NIR technology, since the spectral signature of each pellet can be related to its coating conditions, dosage and release times without the need to resort to traditional methods.
Development of an NIRS method for predicting release time and potency
In order to develop a predictive model for the real-time determination of release times and potency (mg API/g pellet) that is released at 1, 4 and 7 hours, we worked in coordination with a major Spanish pharmaceutical laboratory and the portable NIR spectroscopic analyser Visum Palm™ manufactured and marketed by IRIS Technology Solutions S.L.
The data provided by the laboratory consists of the NIR spectra of several batches of two drugs based on, on the one hand, an antihistamine which, for confidentiality reasons, we will refer to as “DS”, and on the other hand, a form of vitamin B6 which, for the same reasons, we will refer to as “PH”. In both cases, the active substance was part of the coating of the pellets constituting the vehicle.
The spectra of the pellets were acquired at different times of the coating process, from both wet and dry samples and, in parallel, the respective sample was subjected to the usual analyses in these cases to determine the drug release at 1, 4 and 7 hours and the potency mg PI/g.
The predictive models developed on the basis of the spectral data showed that it is not necessary to dry the samples for the acquisition of the spectra – so the control can be performed directly on the wet sample, saving time and handling – and that there is a clear relationship between the NIR spectra, the power and the release times of 1h, 4h and 7h, as we will see below.
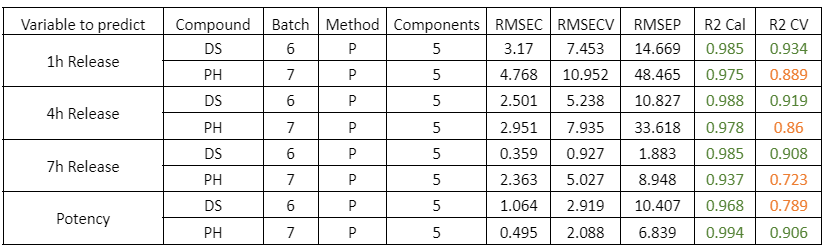
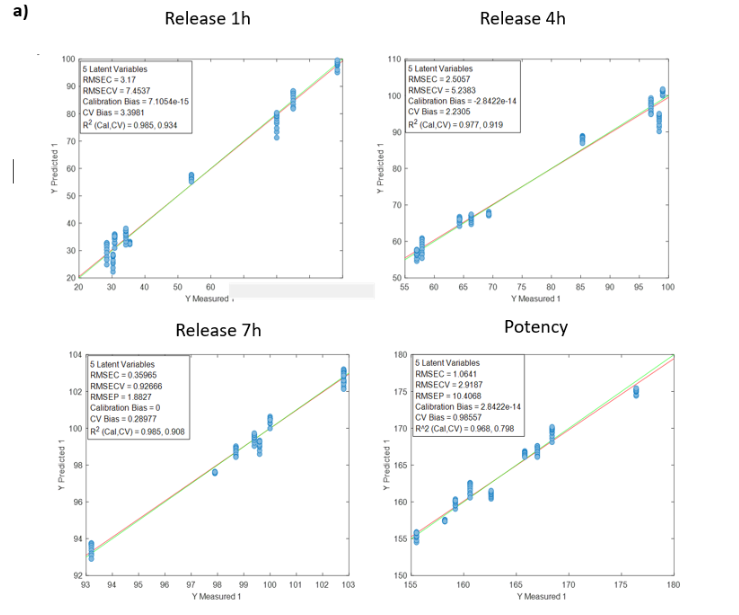
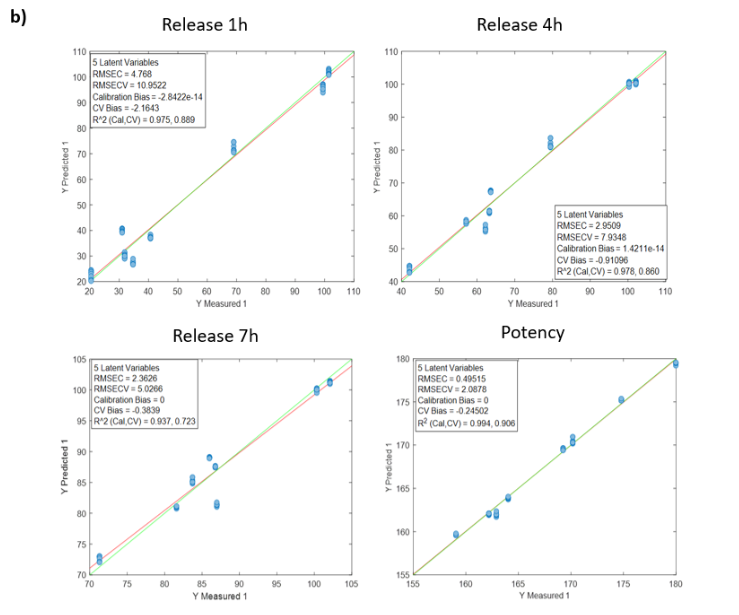
PH compound - Coating process and NIR spectroscopy
Table 1: Quality parameters of the prediction models for the release at 1, 4, 7 hours and the potency in the samples with different stages of the PH coating process. The * symbol indicates that the model was built by using the average NIR spectra of the replicates of each sample.
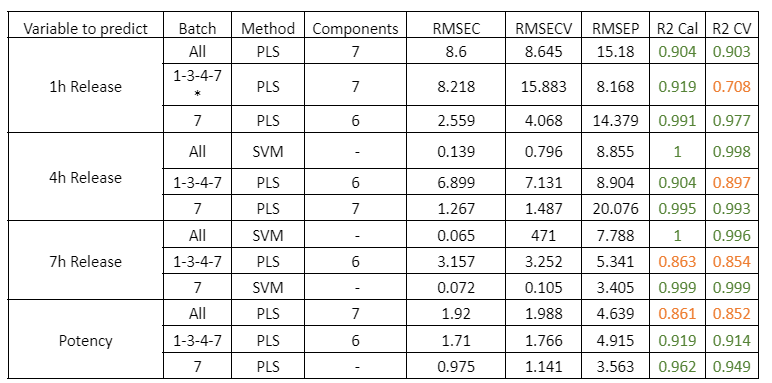
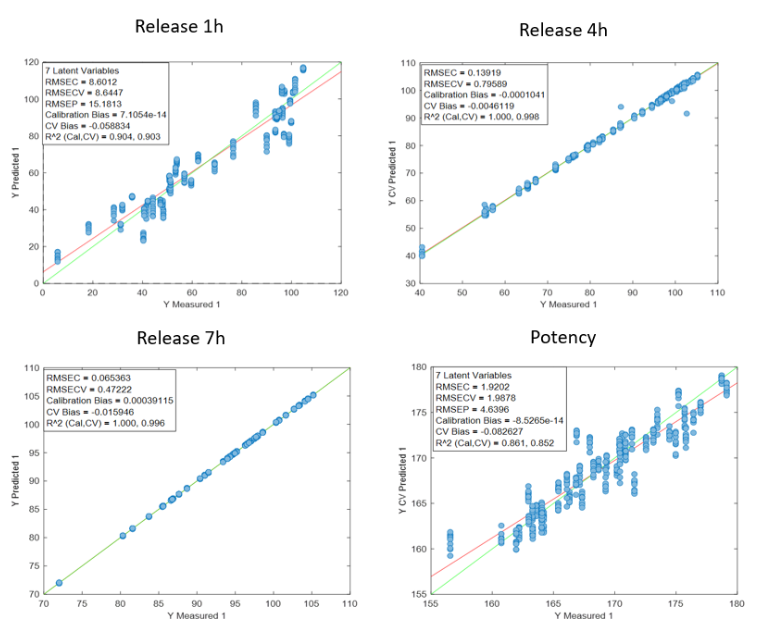
Figure 1: Regression curves for PH a) All samples; b) Batches 1,3,4 y 7; c) Mean spectra of batches 1,3,4 y 7; d) Batch 7.
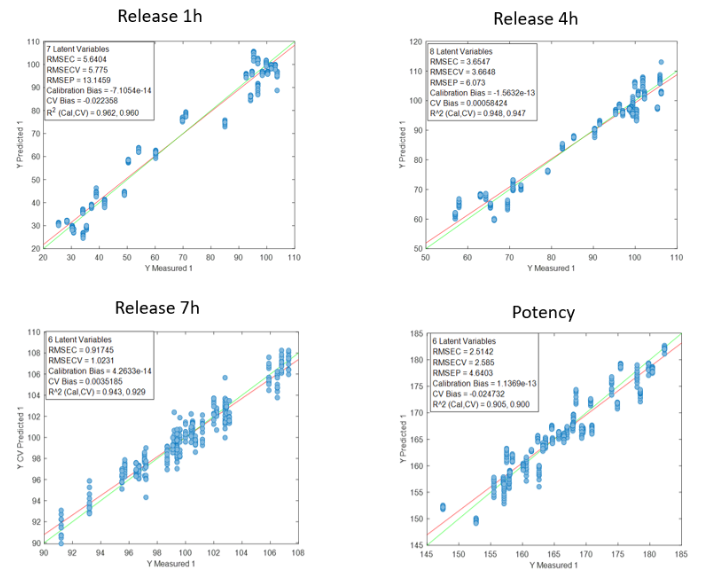
DS compound
Table 2 shows the quality parameters of the models for the analysis of wet DS samples. All samples were studied simultaneously: samples from batches 6, 8 and 10 together, and batch 6 separately. Batches 6, 8 and 10 were chosen for the study of a set of batches because they had the largest number of samples. In addition, batch 6 was chosen for individual analysis as it contained the most samples with the optimal release parameters for the case study.
Table 2: Quality parameters of the prediction models for the release at 1, 4, 7 hours and the potency in the samples with different stages of the DS coating process.
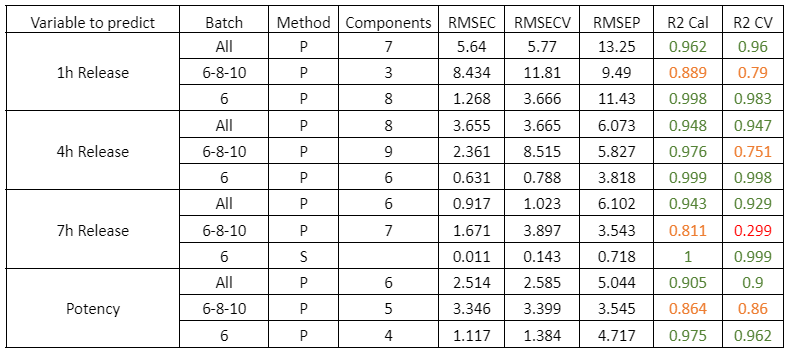
Figure 2 shows the regression curves resulting from the study for the active substance DS. The values of the quality parameters for the DS models show, in general, a good correlation. As an observation, it is noted that the error increases when data from different batches are used, probably because the process conditions of each batch are different due to the fact that the data come from the development and fine-tuning phase of the production process. The prediction of the release at 7 hours is worse than that of the other parameters, probably because the end of the release process has been reached in many cases before that time.
Figure 2: Regression curves for DS a) all samples; b) Batches 6, 8 y 10; c) Mean spectra of batches 6, 8 y 10; d) Batch 6.
Prediction of dry samples
Table 3: Quality parameters of the prediction models for the dry samples of DS batch 6 and PH batch 7.
The prediction models of the dry samples for individual batches of PH and DS show a good correlation. It should be noted that the prediction error is due to the few validation samples used.
Figure 3: Regression curves for Dry simples of a) DS batch 6 y b) PH batch 7.
Conclusions - Coating process and NIR spectroscopy
- There is a clear correlation between NIR spectra with release times of 1h, 4h and 7h, as well as with potency, for both DS and PH, although it is slightly worse for PH.
- In the case of the 7h release, the correlation seems a bit weaker, possibly because it is close to the maximum release (at the release plateau) or due to differences in the pH of the samples.
- The different batch production conditions affect the robustness of this correlation, an inherent variability factor because the samples come from the development phase of the production process (fine-tuning phase) and not from the NIRS method.
- Individual batch tests show a good correlation for both wet and dry samples. Since the results in both cases are similar, it can be concluded that drying is not necessary to correlate the studied parameters (release time and potency) with the NIR spectra.
- Finally, from the analysis of the results analysed, it can be concluded that NIR spectroscopy can be used to optimise the control of the coating process of granular forms and that, from a technical point of view, it is a robust and evidence-based method. However, for all the cases evaluated in this document, definitive models have to be made once the production process has been fully developed.