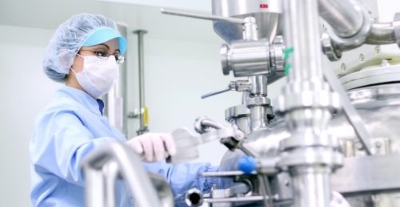
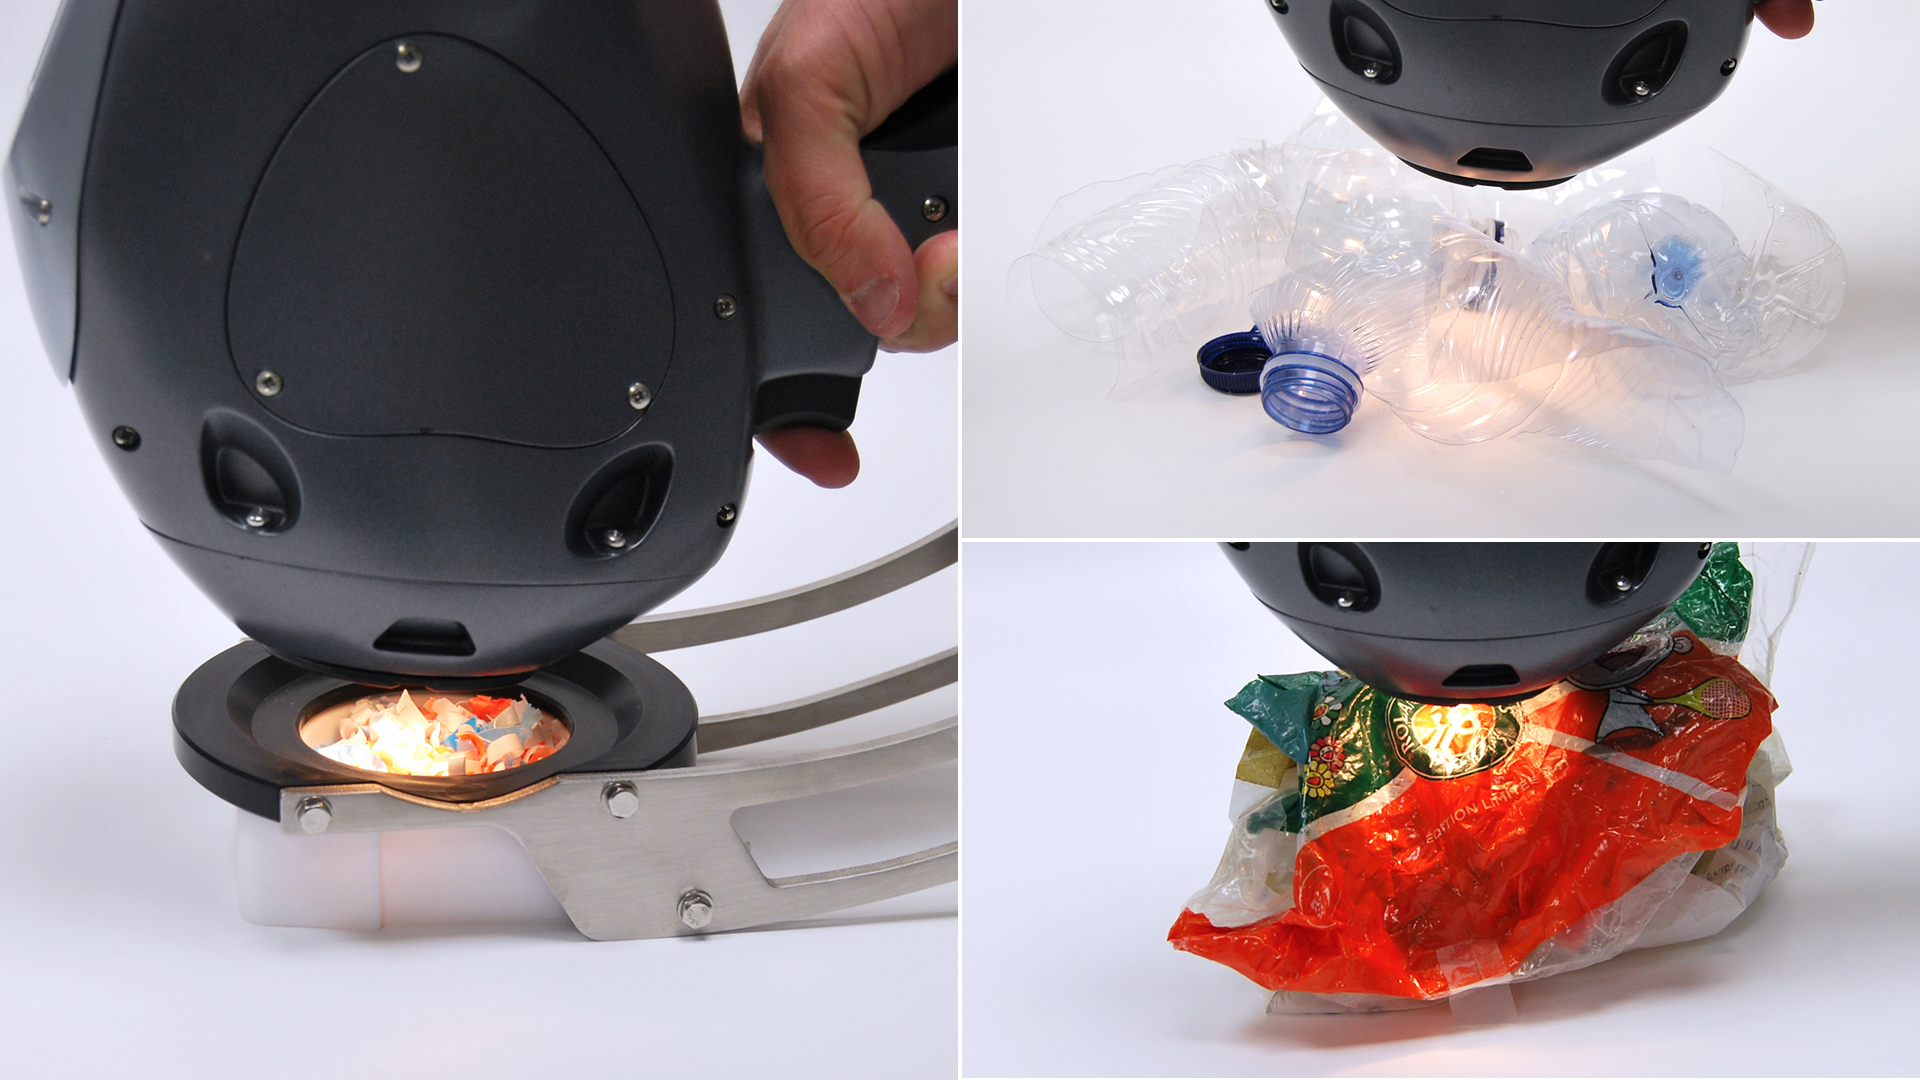
 European Commission Highlights IRIS Technology Solutions for its Innovative Role in the AIDPATH Decentralized Advanced Therapy Production Project
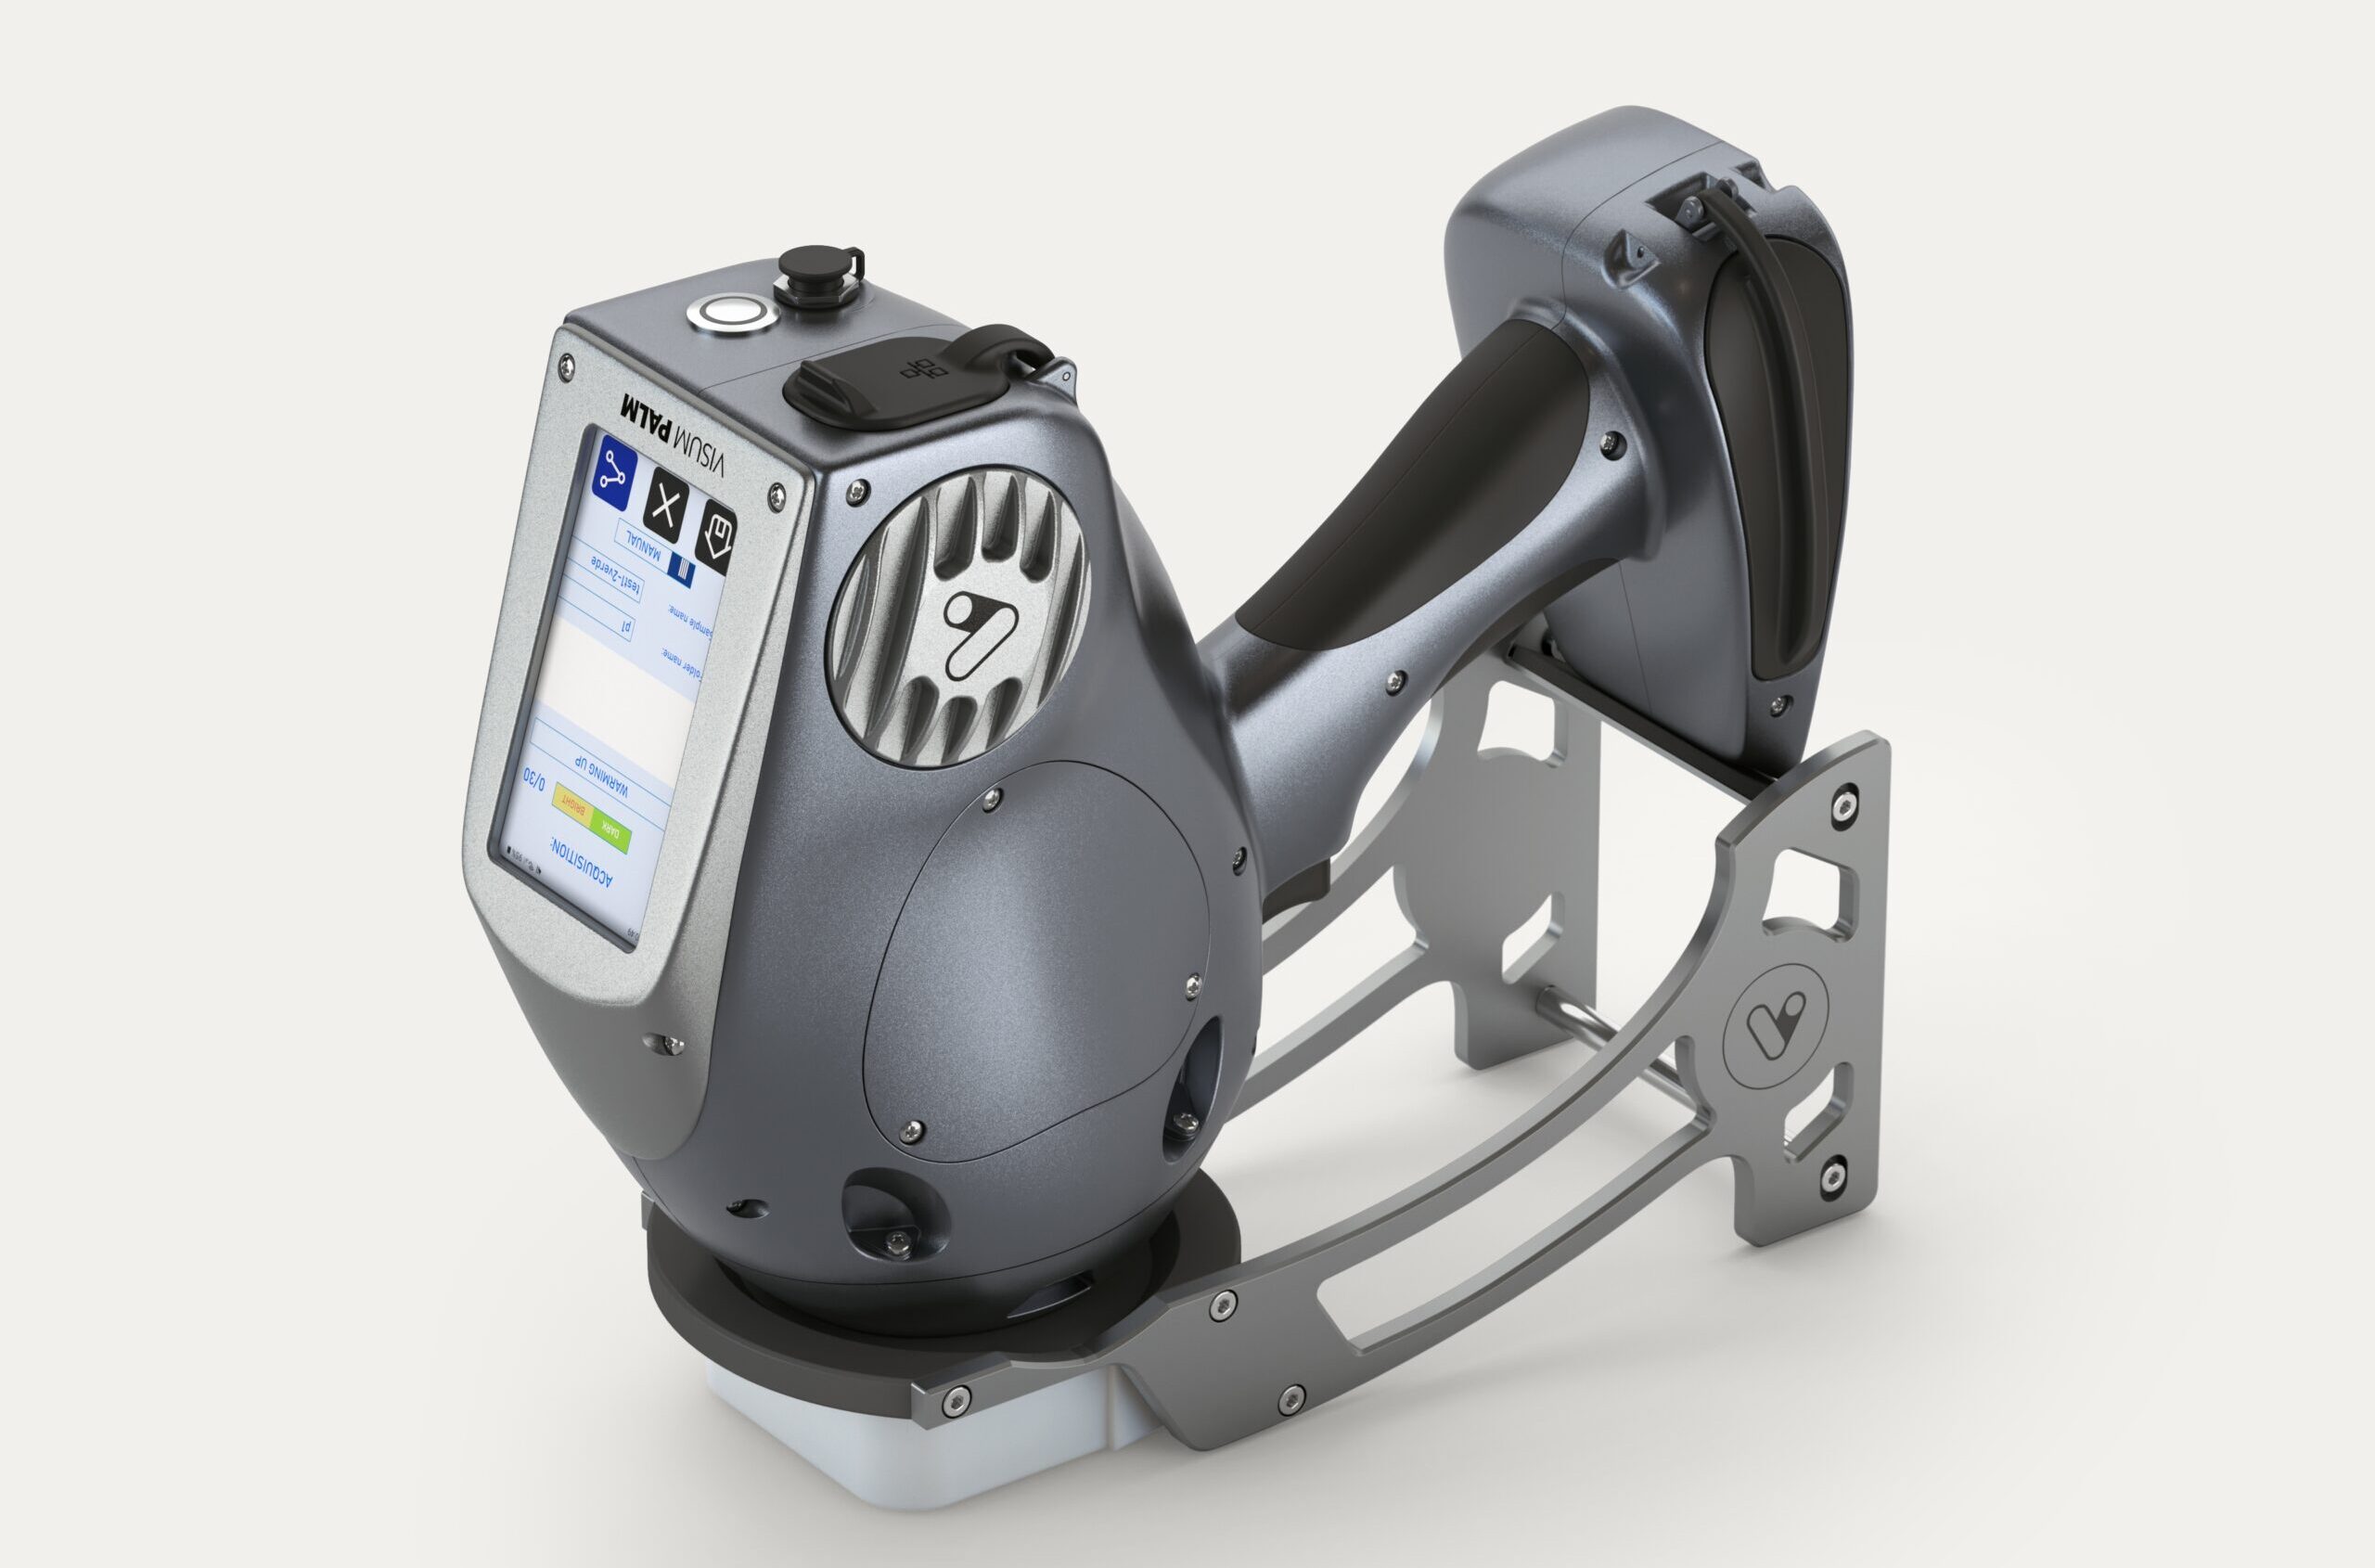
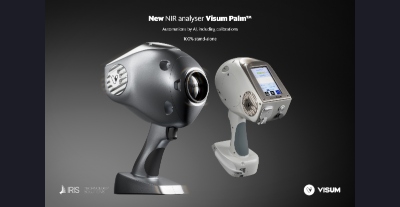
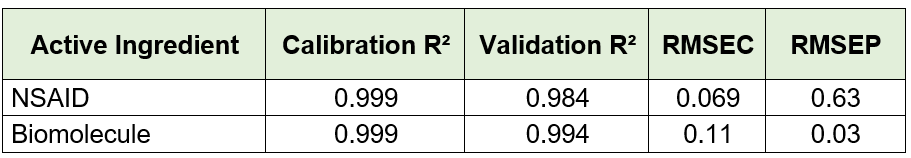
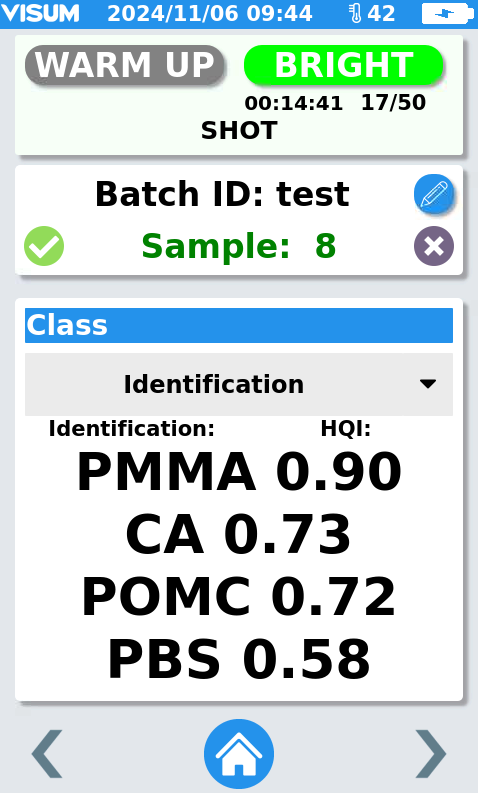
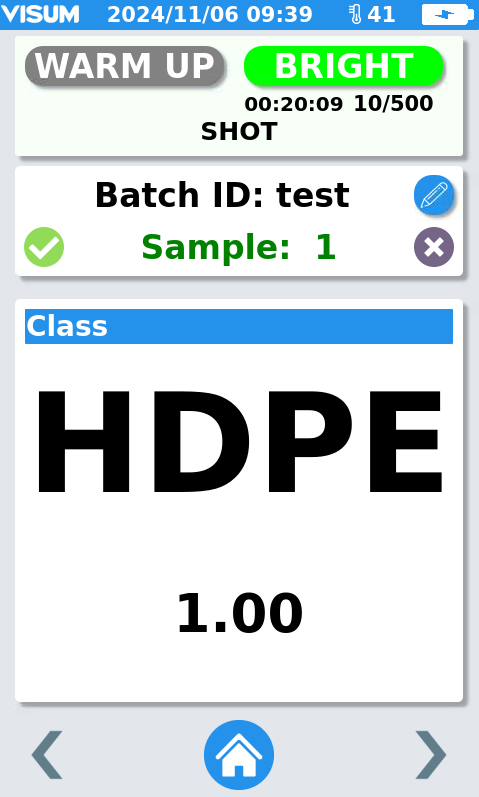
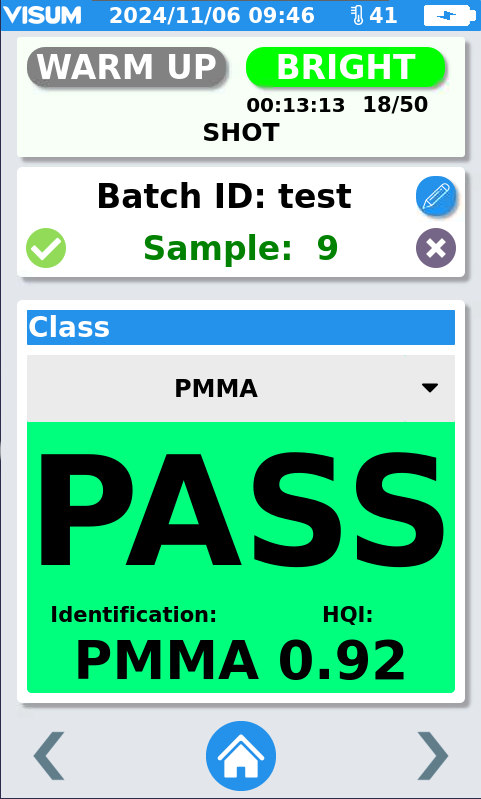
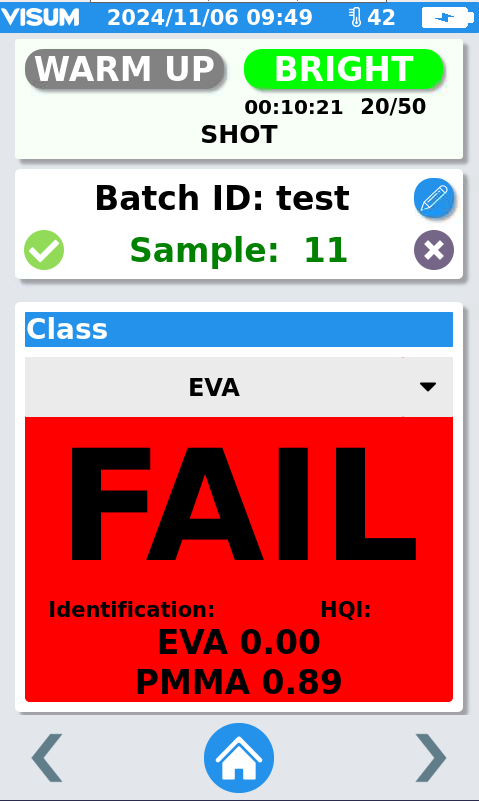
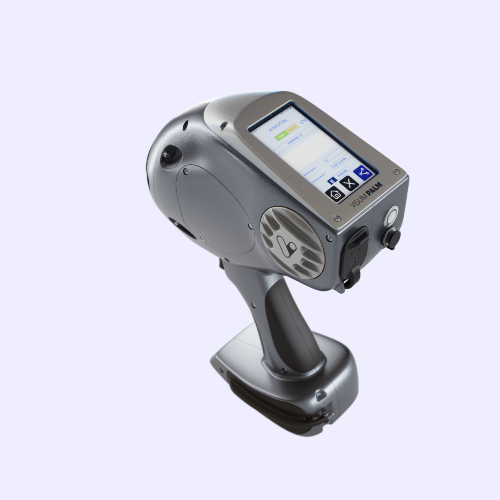
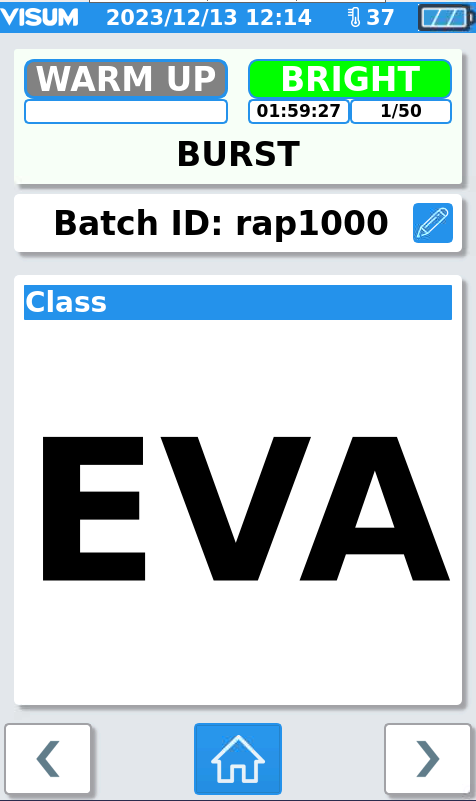
 Visum Palm GxP: The New NIR Analyzer for Pharmaceutical

Raman Process Analyzer for Real-Time Rapamycin Monitoring: Results Comparable to HPLC

In-Line Raman Process Analyzer Applied to Rapamycin Purification
Raman spectroscopy, when implemented as a Raman Process Analyzer for real-time measurements, is a powerful technology for process control and optimization in pharmaceutical and biotechnological manufacturing. In this context, the in-line Raman process analyzer developed and manufactured by IRIS Technology Solutions (Barcelona) stands out as a high-performance analytical solution for real-time quantification of critical compounds and continuous monitoring of process performance.
Unlike conventional analytical techniques such as HPLC, which involve delayed response times, consumables, and intensive laboratory resources, a Raman process analyzer enables direct, real-time insight into the process. This article presents a concrete industrial application: the use of the Visum Raman In-Line analyzer to monitor rapamycin concentration during the purification stage.
The results demonstrate that this process Raman analyzer, integrated in an at-line configuration and mounted on a mobile rack, can effectively replace offline HPLC analysis. The application was developed in collaboration with the pharmaceutical company MyBiotech GmbH (Germany) and illustrates the value of Raman-based process analytics within PAT strategies.
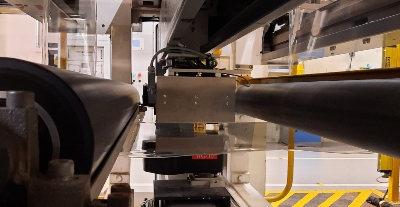
Rapamycin Extraction and Purification Process
Rapamycin is a macrolide compound widely used to prevent organ transplant rejection. It is produced through fermentation by cultivating Streptomyces rapamycinicus in bioreactors under controlled substrate feed, temperature, and pH conditions. After fermentation, rapamycin is extracted using an organic solvent, resulting in a complex mixture containing the target compound and several by-products.
The extract is subsequently purified using a chromatographic column, where rapamycin is separated from impurities and collected in enriched fractions. Traditionally, aliquots are manually taken from the column outlet and analyzed by HPLC to determine which fractions contain rapamycin and at what concentration.
To replace this offline workflow, a dedicated measurement chamber was installed at the outlet of the chromatographic column. An immersion probe connected to the Raman Process Analyzer was inserted into this chamber, allowing continuous, real-time measurement of rapamycin concentration. This setup enabled immediate decisions on fraction collection, classification, solvent recirculation, or rejection, while avoiding errors, delays, and contamination risks associated with manual sampling.
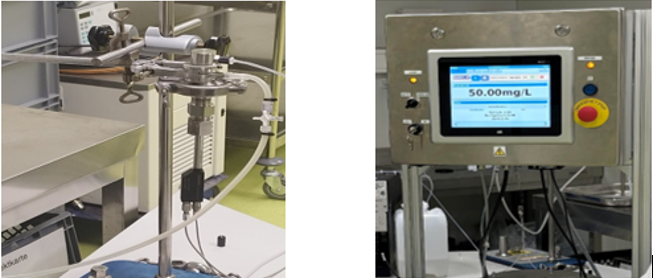
Integration of the In-Line Raman Process Analyzer
The Visum Raman In-Line was deployed as an in-line Raman process analyzer, configured in an at-line setup on a mobile rack. This flexible integration allowed the analyzer to operate directly next to the purification system while maintaining full access and visibility for operators.
The Raman probe continuously measured the process stream at the column outlet, providing real-time feedback on rapamycin presence and concentration. During a typical separation run, which can last several hours, multiple Raman measurements were collected for each fraction, offering significantly higher temporal resolution than HPLC-based analysis.
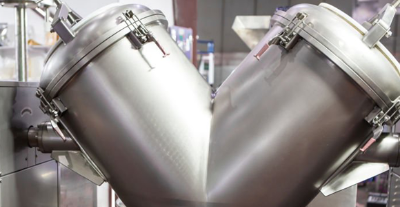
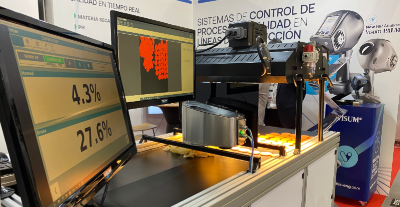
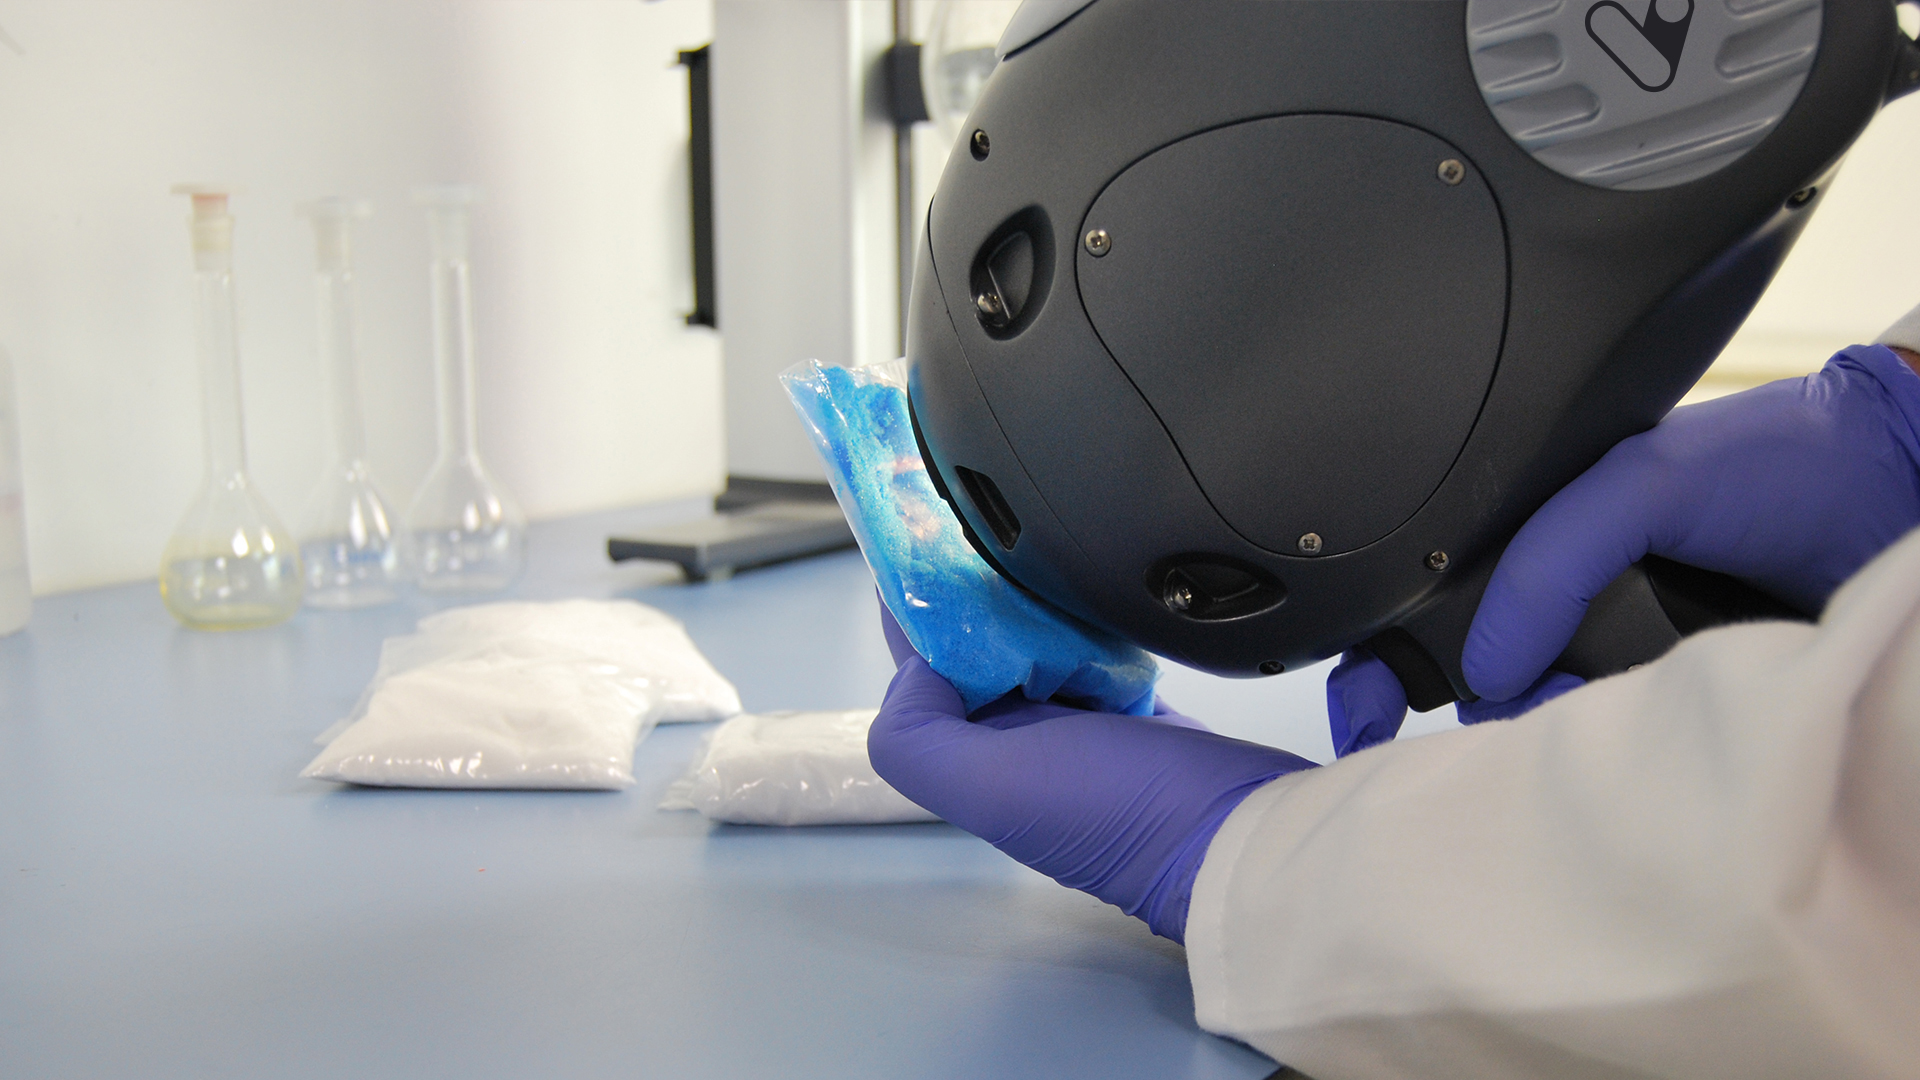
Figure 1.
Top: Rapamycin purification system.
Bottom left: Raman probe inserted into the measurement chamber.
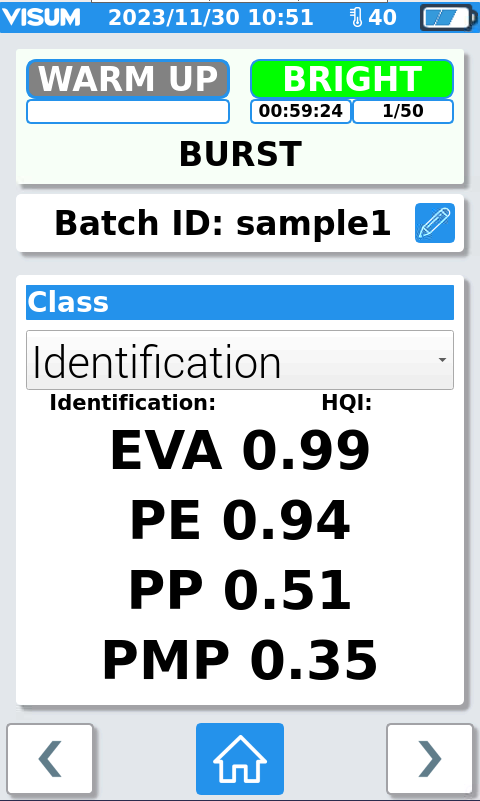
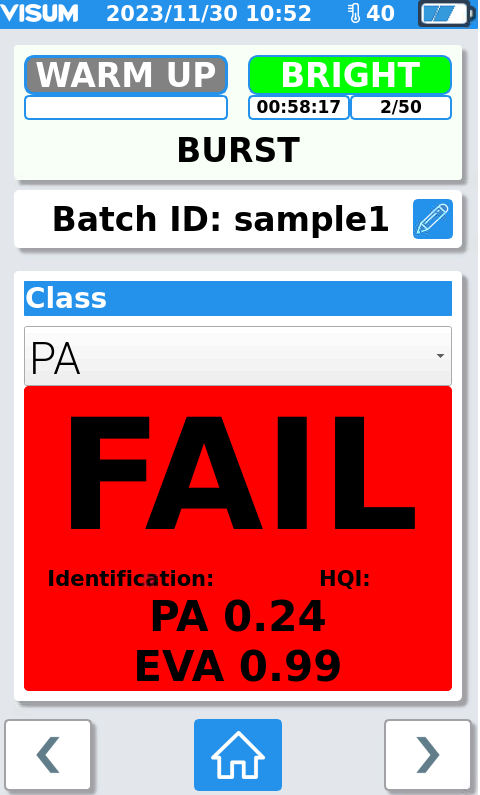
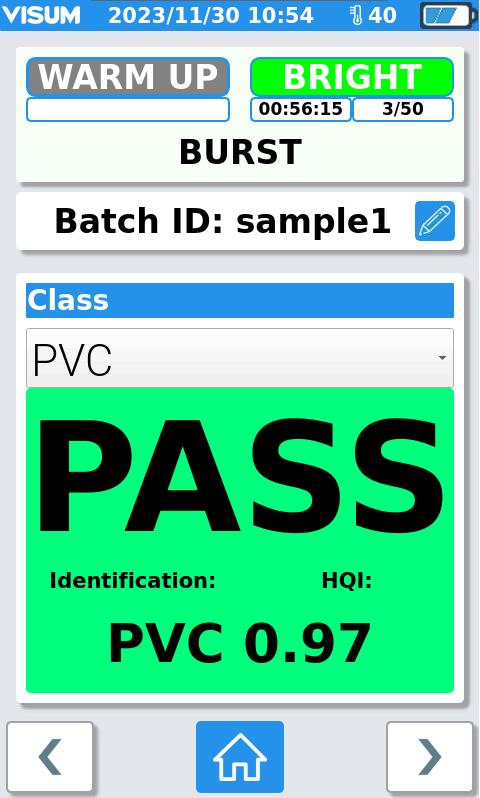
Bottom right: Screen of the Raman Process Analyzer mounted on a mobile rack, displaying real-time rapamycin concentration.

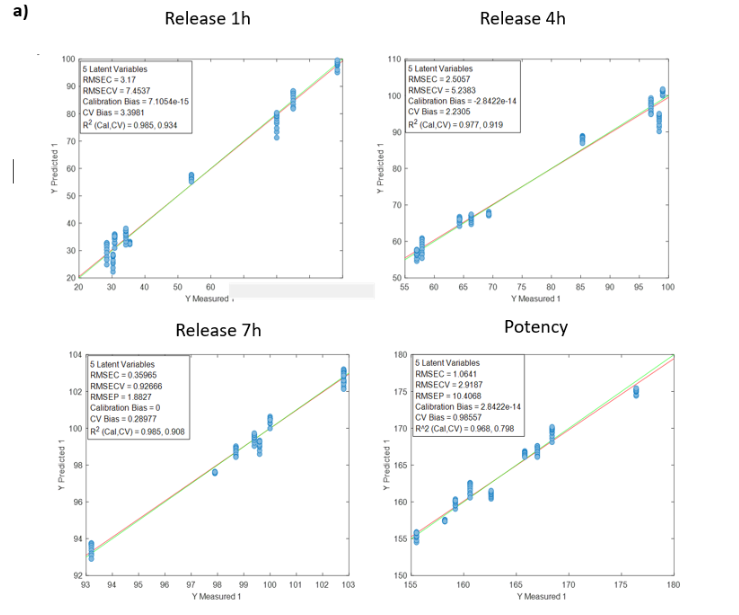
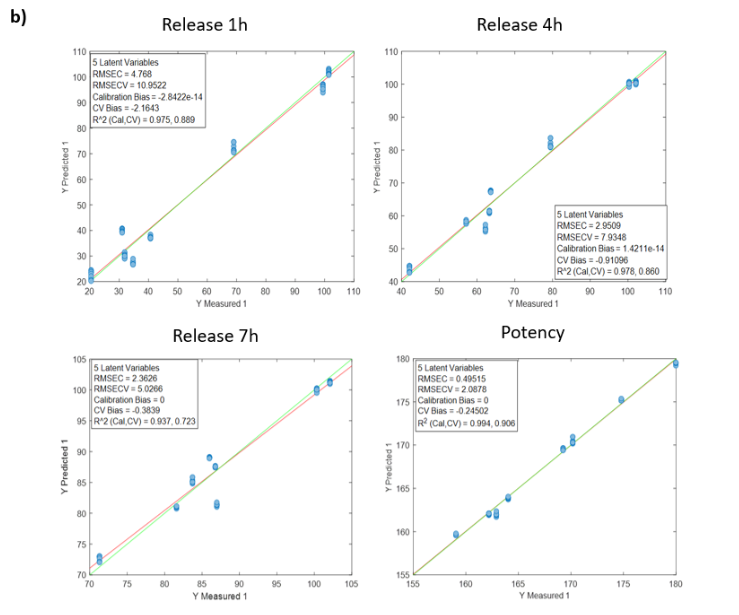
Calibration and Chemometric Modeling of the Raman Process Analyzer
To calibrate the Raman process analyzer, six different preparations were evaluated. These preparations covered a range of rapamycin concentrations, by-product profiles, and flow rates, ensuring realistic process variability.
The analyzer was configured to collect three Raman spectra per minute and report averaged values. For chemometric model development, all Raman spectra recorded during the filling of each flask were averaged to obtain one representative spectrum corresponding to each HPLC reference value.
Advanced chemometric techniques were applied to process the spectral data and build quantitative models. To ensure realistic performance evaluation, each preparation was treated as an external validation set. In practice, the model used to predict one preparation was developed using data from the other five preparations. This approach was repeated until all six preparations had been independently predicted by the analyzer.
Results from the Raman Process Analyzer
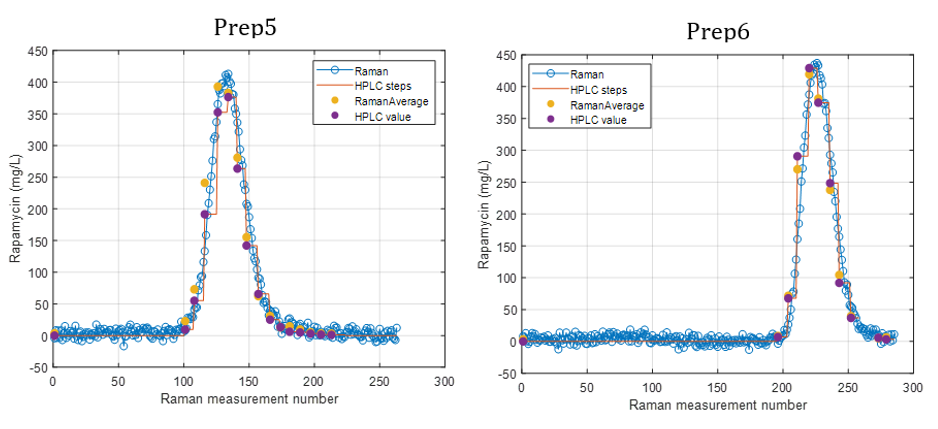
Figure 2 presents the prediction results obtained with the in-line Raman process analyzer for the six preparations. The trend of rapamycin concentration predicted by Raman spectroscopy closely follows the trend measured by HPLC.
For each HPLC data point, between three and eight Raman predictions were available. The average of these Raman predictions showed strong agreement with the corresponding HPLC values. One deviation was observed in Preparation 3, where a mismatch between the Raman measurement and the collected HPLC sample likely occurred due to timing differences between measurement and fraction collection.
When all predicted and reference values were compared, the analyzer achieved a low prediction error of 15.7 mg/L and a high coefficient of determination (R² = 0.98). This prediction error is comparable to the quantification limit of the method.
At rapamycin concentrations below 15 mg/L, Raman predictions fluctuated between −15 and +15 mg/L, indicating the practical detection limit of the model. Within the validated concentration range of 15–450 mg/L, the in-line Raman process analyzer demonstrated excellent accuracy, with results remarkably similar to those obtained by HPLC.
Figure 2.
Rapamycin concentration predicted by the Raman Process Analyzer and reference HPLC data over time for the six preparations.

Implications for Raman Process Analysis and PAT Applications
This study confirms that a Raman process analyzer is a reliable and precise solution for real-time monitoring of rapamycin purification. The Visum Raman In-Line enabled continuous quantification of rapamycin with performance comparable to HPLC, while significantly improving process efficiency and responsiveness.
By eliminating the need for manual sampling and offline analysis, the Visum in-line Raman analyzer reduced laboratory workload, accelerated decision-making, and improved process control. These advantages make Raman-based process analytics particularly attractive for pharmaceutical and biotechnological manufacturing.
Importantly, this approach is fully transferable to other applications where real-time quantification during purification or formulation is critical, such as antibodies, recombinant proteins, vaccines, metabolites, and other active pharmaceutical ingredients. As part of a broader PAT strategy, a Raman process analyzer provides continuous insight into the process, enabling higher efficiency, better quality control, and more robust manufacturing operations.